Performing Thread Analysis
PUBLISHED
![]()
![]()
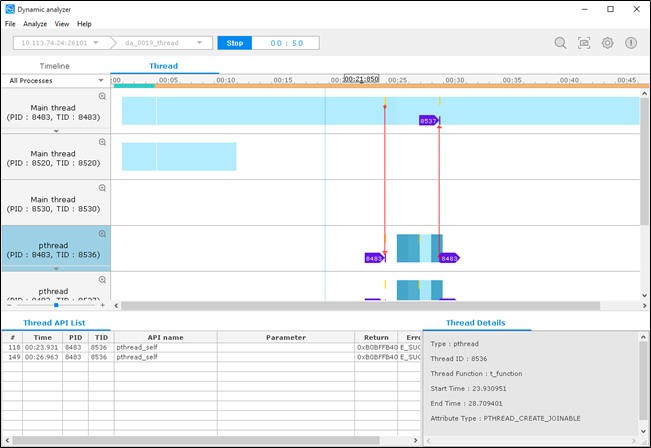
The Thread tab of the Dynamic Analyzer displays information about threads and synchronization.
The tab consists of the following views:
- Thread chart displays thread and synchronization operations and the thread load as a time flow graph.
- Thread API List table displays the thread or synchronization object APIs selected in the thread chart.
- Thread Details view displays detailed information on the thread or synchronization object selected in the thread chart.
Figure: Thread analysis
Thread Chart
The thread chart displays the thread and the related synchronization object in a tree format using a graph.
Figure: Thread chart
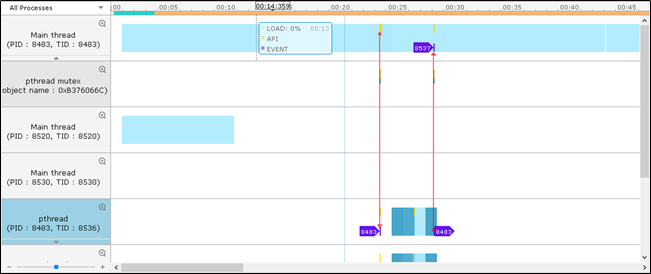
The chart classifies thread and synchronization object states by color and shape:
- Blue colored area of the thread line depicts the thread load of that time frame. A darker color means higher load.
- Yellow vertical bar points the time when the API was called.
- Violet arrow displays the interaction between threads. The number inside the arrow is the thread ID of the related thread.
- Orange colored area of the synchronization object line displays the possession of that synchronization object (lock).
- Gray colored area of the synchronization object line shows the waiting time for acquiring that synchronization object.
Thread API List
The Thread API List table displays the APIs associated with the thread or synchronization object selected in the thread chart.
Figure: Thread API List table
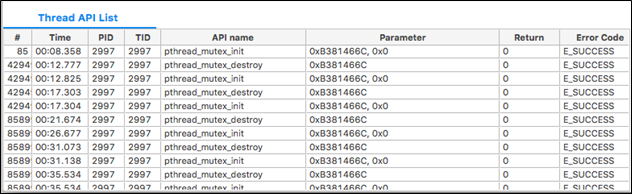
The table contains the following columns:
- # (integer): Unique log index
- Time (time): Time when the API was called
- PID (integer): Process ID of the API
- TID (integer): Thread ID of the API
- API name (text): Name of the API
- Parameter: Input parameter of the API
- Return (integer): Return value
- Error Code (text): Error description of the API; a normal end return is E_SUCCESS
Thread Details
The Thread Details view displays detailed information about the thread or synchronization object selected in the thread chart.
Figure: Thread Details view
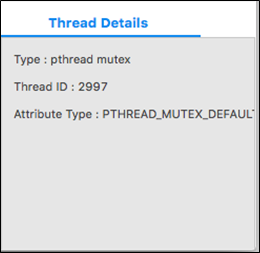
The view contains the following fields:
- Type: Type of the thread or synchronization object
- Thread ID: Thread ID (LWP) of the thread
- Thread Function: Name of the function which the thread is executing
- Start Time: Start time of the thread
- End Time: End time of the thread
- Attribute Type: Attribute type of the thread