Monitoring Performance with Dynamic Analyzer
PUBLISHED
![]()
![]()
The Dynamic Analyzer is a performance monitoring and analysis tool for your native applications on a Tizen device or the emulator. The main focus of the Dynamic Analyzer is to analyze your application for potential performance issues, such as high usage of CPU, memory, file, or network operations.
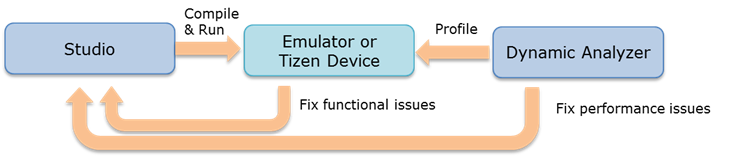
The Dynamic Analyzer is designed to analyze performance issues on your application after development, to help you optimize the application. The following figure shows the basic workflow for how the Dynamic Analyzer works with other Tizen tools:
- Develop your application with Tizen Studio.
- Compile and install the application to an emulator or Tizen device target.
- Verify the application on the target and fix any functional issues to fulfill the requirements.
- Profile the application with the Dynamic Analyzer.
- Study the tracing result and fix any performance issues.
Figure: Basic workflow using Dynamic Analyzer
Using the various profiling features of the Dynamic Analyzer, you can determine where your application can be optimized further.
Profiling Features
When the Dynamic Analyzer is launched, a feature selection dialog opens. You can select the available features for your profiling based on the selected target profile.
Figure: Feature selection dialog
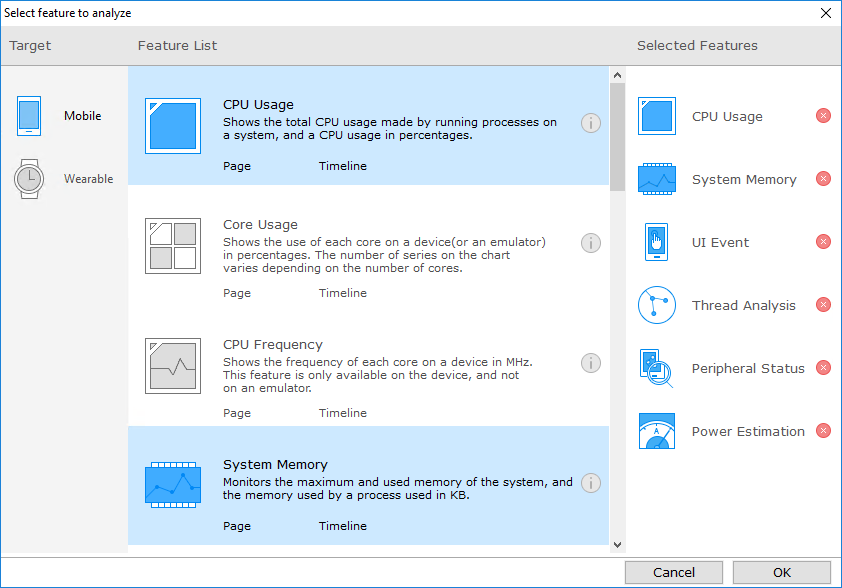
The following table lists the supported features on the Dynamic Analyzer. Every feature is placed onto a specific group (CPU, Memory, File System, Graphics, Network, UI, Synchronization, or Energy) to help you understand the profiling category.
Table: Available features
| Group | Feature | Description | Page tab where shown |
|---|---|---|---|
| CPU | 
CPU Usage |
Shows the total CPU usage made by target processes on a system and the CPU usage in percentages. | Timeline |

Core Usage |
Shows the usage of each core on a device (or an emulator) in percentages. The number of series on the chart depends on the number of cores. | Timeline | |

Core Frequency |
Shows the frequency of each core on a device in MHz. This feature is only available on devices, not on emulators. | Timeline | |
| Memory | 
System Memory |
Monitors the maximum and used memory of the system, and the memory used by a process, in KB. | Timeline |

Process Memory |
Monitors a partition of the PSS, 3D, and GEM memory of a process in KB. | Timeline | |

Heap Allocation |
Records all memory allocations and frees the requested allocations from the executable and shared libraries. This feature shows un-freed allocations (leak candidates). | Memory | |
| File System | 
Disk IO |
Shows the system I/O events, such as the occurrence of the read/write operations and the number of bytes in them. | Timeline |

File Analysis |
Analyzes file activities, such as open, close, and lock operations, in a separate analysis view. | File | |
| Graphics | 
OpenGL ES Analysis |
Analyzes OpenGL® (Open Graphics Library) 2.0 and EvasGL information used on a process. It shows detailed OpenGL® API lists, and context, program, and texture information at a particular point in time. | OpenGL ES |
| Network | 
Network IO |
Shows the number of bytes that the system sends and receives through the network. | Timeline |

Network Analysis |
Analyzes network activities, such as recv, send, bind, and accept operations, in a separate analysis view. | Network | |
| UI | 
UI Event |
Shows the touch (press, move, release), gesture (distance, movement, angle), and orientation change events. | Timeline |

Screenshot |
Shows a series of screenshot events taken by a user. It can be set to capture a screenshot during each screen transition or at specific time intervals. | Timeline | |

UI Hierarchy Analysis |
Analyzes the hierarchy and details of an EFL-based application using EFL UI objects (Evas, Elementary, and Edje). | UI Hierarchy | |
| Synchronization | 
Thread Analysis |
Analyzes the internal threads of a process and its synchronization operation. | Thread |
| Energy | 
Peripheral Status |
Shows the on/off state of the Wi-Fi, Bluetooth, GPS, data network, and camera peripherals. | Timeline |

Power Estimation |
Calculates the power consumption of the CPU, flash, LCD, Wi-Fi, and Bluetooth with an accurate estimation model. | Timeline |