Getting Code Execution Information with Code Coverage
PUBLISHED
![]()
![]()
Dependencies
- Tizen Studio 1.1 and Higher
The Code Coverage is a profiling tool used to determine the coverage details of Tizen native applications. It finds the parts of code that are executed during a particular scenario. A program with high code coverage, measured as a percentage, has had more of its source code executed during testing. This suggests it has a lower chance of containing undetected software bugs.
The Code Coverage tool is based on the llvm-cov tool. With it, you can detect parts of code that are not covered by a scenario and make sure that the uncovered code does not cause errors at runtime. Functional, statement, and branch coverage are supported in the Code Coverage tool.
Using Code Coverage
- Make sure that you have an emulator or a connected target device running.
- If you want to try out the tool and do not have an applicable project to test, create a test project with the Project Wizard using a template or sample. For more information on creating a project, see Creating Your First Tizen Mobile Native Application.
To use the Code Coverage tool:
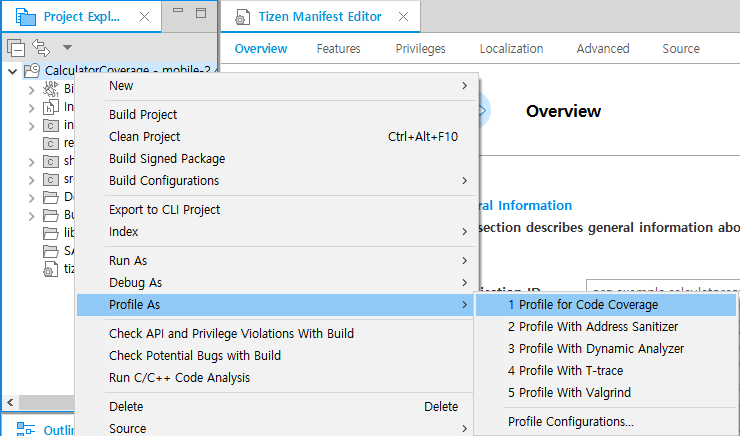
- In the Project Explorer view, right-click the project and select Profile As > Profile for Code Coverage.
The profiling instruments the code and compiles the project for Code Coverage. Finally, it launches the application on the connected target or emulator.
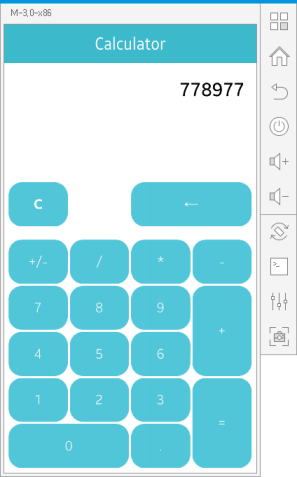
- After the application is launched, run the application scenario you want to test.
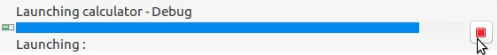
-
To get the coverage report, press the Stop/Cancel Operation button in the Progress view of Tizen Studio.
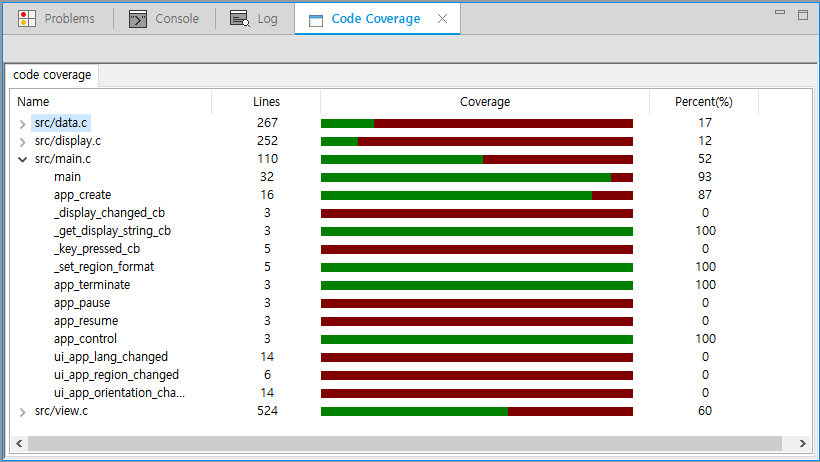
- Tizen Studio shows the code coverage information in the editor after the application has closed. A Code Coverage view also opens to give a summary of the code coverage percentage for each file.
The code covered during the scenario has a green highlight and the uncovered code has a red highlight.
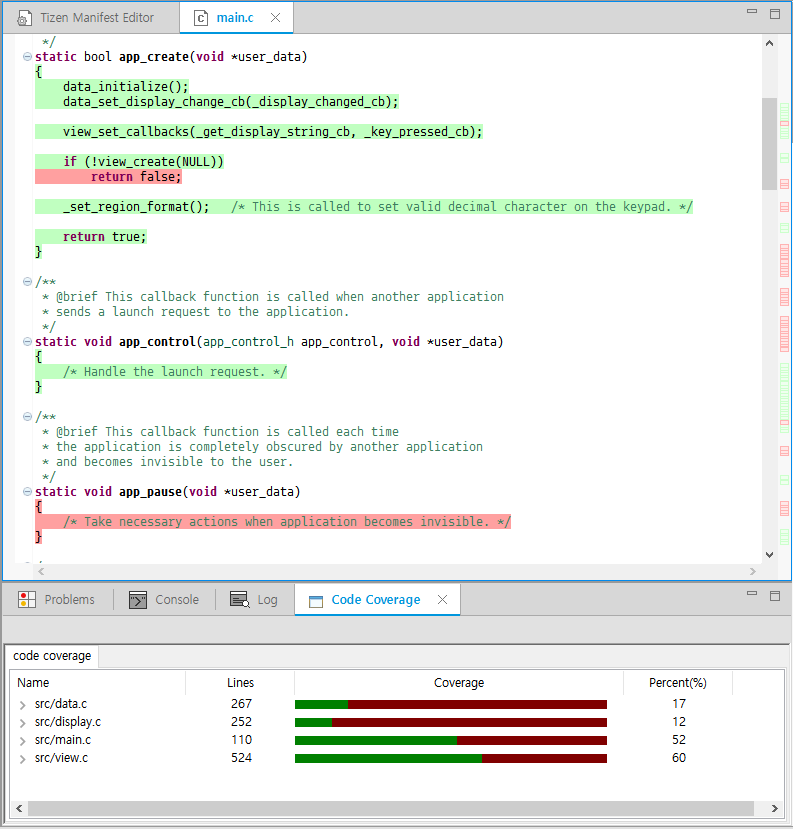
Each row of the Code Coverage view can be expanded to show the function level coverage information.