Getting Crash Data from Call Stack View
PUBLISHED
![]()
![]()
Dependencies
- Tizen Studio 1.0 and Higher
The Call Stack view provides information about a crashed API, call stack, or debug message when the application crashes while running. Though debugging tools give more detailed information in the debugging state, the Call Stack view is a useful tool in the running state.
When the application crashes during running, Tizen Studio creates a *.cs file in the crash-info folder under the current project and shows the Call Stack view automatically. The view can also be opened from the Tizen Studio menu by selecting Window > Show View > Other > Tizen > Call Stack.
The Call Stack view has 3 tabs:
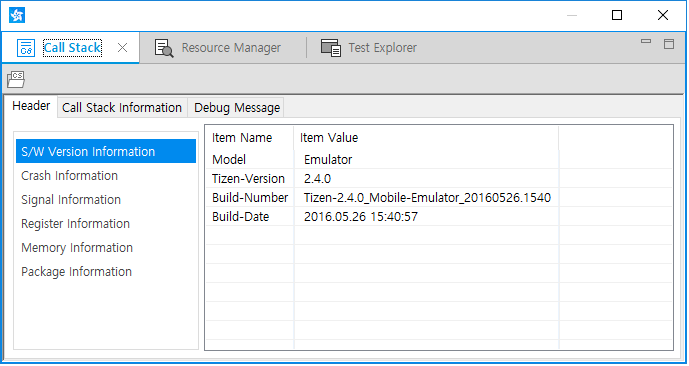
- Header: Provides basic information about the crashed application. Select a specific information type from the left pane.
Figure: Header tab
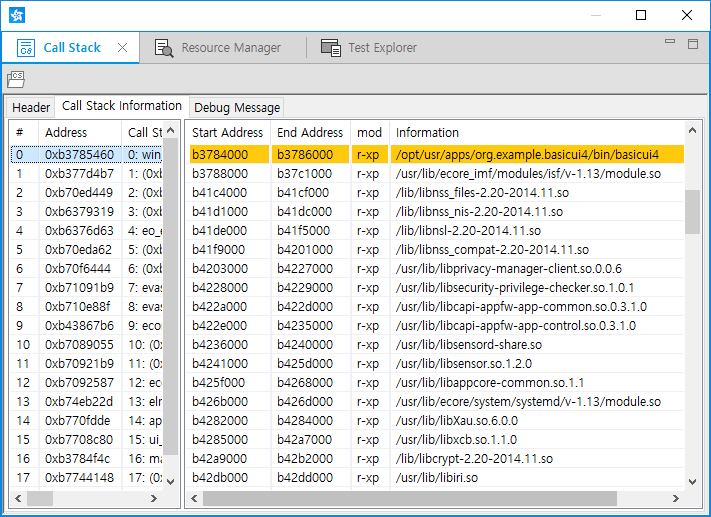
- Call Stack Information: Traces call stack steps to find where the memory block has crashed. If you select a call stack item in the left pane, the search result is shown in the right pane.
Figure: Call Stack Information tab
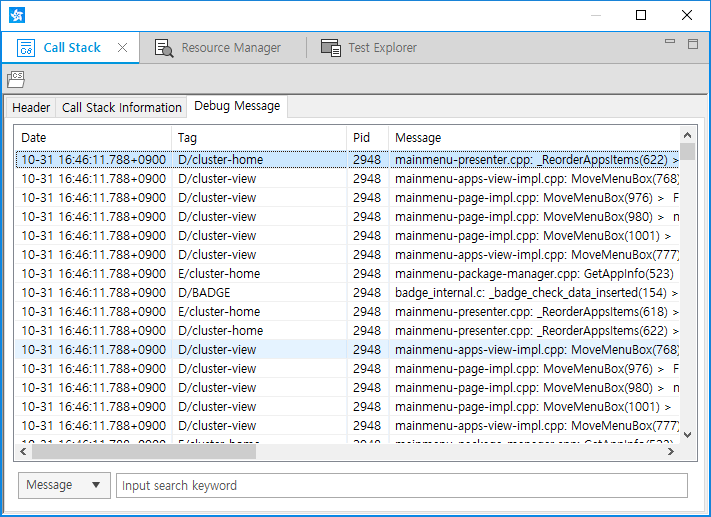
- Debug Message: Provides the latest debug messages and the filtering function similar to the Log view. You can search with keywords filtered by tag, pid, and message.
Figure: Debug Message tab
The Call Stack view shows information only when the application crashes.