Advanced Web Audio API usage
PUBLISHED
Introduction
In the previous article I’ve described basics of the W3C Web Audio API whose current specification is still a Working Draft and Tizen implements the first specification from December 15, 2011. This article describes how to load sounds from internal memory and external sources, play them and control volume. It also covers the implementation details about how to makes use of the mentioned functionalities and using a PannerNode to place a sound in three-dimensional space. In this article, we will explore the subject of nodes. I will show how to use built in filters, how to synthesize sound, how to visualize the sound spectrum and a few more things. Thanks to that, you will be able to create more advanced sound applications that not only play sounds, but also create and modify them.
Nodes description
In this section I will describe the selected nodes that can be used to create, modify and visualize sounds. For more details refer to W3C Web Audio API specification.
OscillatorNode
The oscillator node is one that has 0 inputs, which means that it’s always the first node in a routing graph making it the audio source. It generates a periodic waveform. To create an OscillatorNode we have to call the context’s function named ‘createOscillator’.
var context = new webkitAudioContext();
var oscillator = new context.createOscillator();
We can change the node’s settings to adjust it to our needs. First of all, we have five different waveform types which are: sine (0), square (1), sawtooth (2), triangle (3) and custom (4). The last one will be described later on. We change the waveform type by setting a ‘type’ property of the node.
oscillator.type = oscillator.SINE;
oscillator.type = oscillator.TRIANGLE;
In the picture given below all the predefined waveform shapes are shown:
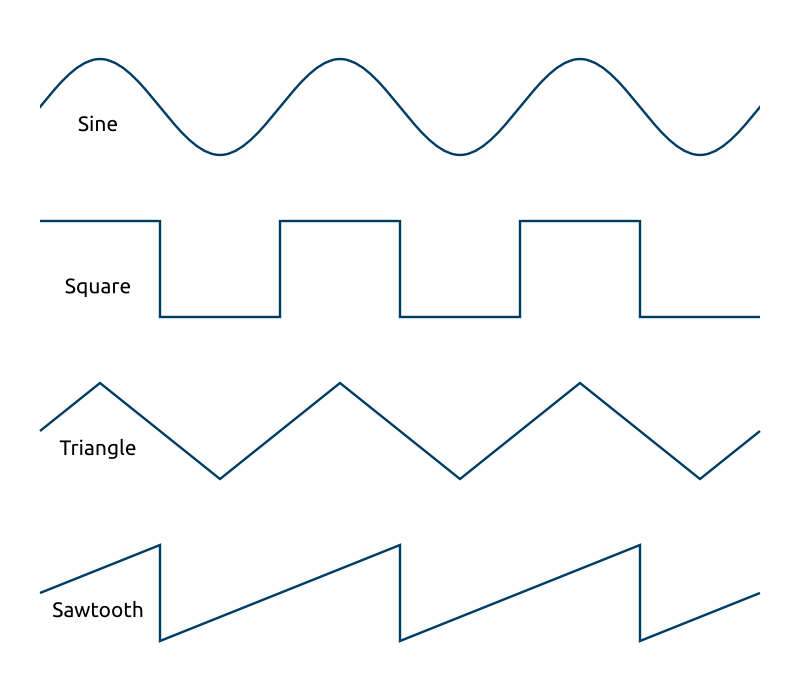 Fig. 1: Predefined waveform types
Other properties that we can change are: the frequency (in Hertz) of the waveform and the detune factor (in Cents). Detuning is a process of offsetting the sound frequency. If you are a musician you’re probably familiar with the term Cent. For those for whom the term is new I will give a short explanation. One cent is 1/100 of a semitone, and one semitone is 1/12 of an octave. One octave is the distance between two consecutive C sounds on a piano keyboard. Knowing the technical details related to sound synthesis, using multiple waveforms and detuning them you can synthesize any instrument.
oscillator.frequency.value = 440; // Set waveform frequency to 440 Hz
oscillator.detune.value = Math.pow(2, 1/12) * 10; // Offset sound by 10 semitones
For more complex waveforms you can create your own shape using the ‘createWaveTable’ and ‘setWaveTable’ context functions and setting the OscillatorNode’s type to ‘custom’. It’s not the subject of this article but if you want to read more about it I refer you to the documentation.
BiquadFilterNode
It’s a powerful node that can be used to control basic tones (bass, mid, treble) or to create an equalizer, which will be shown in the sample application included in this article. You can combine multiple BiquadFilter nodes to create even more complex filters. Generally what it does is take some frequency or range of frequencies and boost or attenuate them. To create a node of this type just call the ‘createBiquadFilter’ function.
var filter = context.createBiquadFilter();
// Connect source node to the filter
source.connect(filter);
This node has several properties which controls its behavior: type, frequency, gain and quality. Visit the website, http://webaudio-io2012.appspot.com/, you can play with them and see how they affect the sound spectrum.
The type property can be one of the following: 0 (Low pass), 1 (High pass), 2 (Band pass), 3 (Low shelf), 4 (High shelf), 5 (Peaking), 6 (Notch), 7 (All pass). It’s just the type of filter that we want to apply to the sound. A detailed explanation of each type can be found on W3C’s Web Audio API specification.
filter.type = filter.LOWPASS; // 0
filter.type = filter.PEAKING; // 5
The frequency property controls which frequency or range of frequencies will be affected by the filter. Some filter types just boost or attenuate a given frequency and its surrounding frequencies. For example the low pass filter determines the range from 0 to the given frequency value and enables the modification of that range.
filter.frequency.value = 440; // in Hertz
The quality and gain properties are not always used. There are filters that use only the quality property or the gain property. The best way to get familiar with the way the filter affects the sound spectrum can be found in previously mentioned website and observe the curve shape change while the properties are being modified. Generally they control how much the sound spectrum should be boosted or attenuated and what range of surrounding frequencies should be affected. The table below shows which properties are used in which filter.
| Filter | Quality | Gain |
| Low Pass | YES | NO |
| High Pass | YES | NO |
| Band Pass | YES | NO |
| Low Shelf | NO | YES |
| High Shelf | NO | YES |
| Peaking | YES | YES |
| Notch | YES | NO |
| All Pass | YES | NO |
// In peaking filter both parameters are used
filter.type = filter.PEAKING;
filter.Q.value = 2; // Quality parameter
filter.gain.value = 10;

// In low pass filter only quality parameter is used
filter.type = filter.PEAKING;
filter.Q.value = 15;
AnalyserNode
We can visualize the sound spectrum in real-time with this node. There are two ways we can get and display sound data. A frequency-domain approach is the analysis of the sound function with respect to the frequency, whereas the time-domain is an analysis with respect to time. To get sound data for the current time we can call one of the three functions of the node: getFloatFrequencyData, getByteFrequencyData, getByteTimeDomainData. As you can see the first two differ only in the type of data they work on. We have to pass an array of the given type as first parameter of these functions, which is shown in the code below.
var analyser = context.createAnalyser();

// Connect source node to the analyser
source.connect(analyser);

// Create arrays to store sound data
var fFrequencyData = new Float32Array(analyser.frequencyBinCount);
var bFrequencyData = new Uint8Array(analyser.frequencyBinCount);

// Retrieve data
analyser.getFloatFrequencyData(fFrequencyData);
analyser.getByteFrequencyData(bFrequencyData);
analyser.getByteTimeDomainData(bFrequencyData);
We create objects of two types Float32Array and Uint8Array which are new elements of the HTML5. They’re views (arrays) that can wrap Array or ArrayBuffer and cast their elements to the given type: 32 bits float or 8 bits unsigned integer. The array size should be equal to the ‘frequencyBinCount’ parameter of the node, however if a smaller provided, the excess elements will be omitted. We fill views (arrays) with data, and now it can be used to visualize sound.
for (var i = 0; i < bFrequencyData.lenght; i++) {
    // Do something with sound data
    bFrequencyData[i];
}
The process of data visualization will be described in details in the sample application section.
Manual buffer data creation
The sound is a combination of waveforms with different frequencies and shapes and the sound data is an array of values representing that combination. In most cases, you will load a sound data from the file, but there is a possibility to create the sound data byte by byte. I will describe the process of noise creation, however if you have knowledge about sound synthesis you can try to create your own waveform functions and combine them.
The process starts from the creation of an AudioBuffer object. You create it by invoking the ‘createBuffer’ function of the context object. It takes three parameters as follows:
- the number of channels – 1 for mono, 2 for stereo sound etc.
- buffer length – determining how many sample-frames you want to provide,
- sample rate – determines how many sample-frames will be played per second. Sample rate determines the quality of the sound. In general it should be greater than twice the maximum frequency of the signal being sampled. In this term, if the highest frequency is 22050 Hz we should set it to 44100 Hz.
// Create buffer with two channels
var buffer = context.createBuffer(2, 44100, 44100);
Having created the buffer, we need to retrieve channel’s data by using ‘getChannelData’ on the buffer and passing the channel number (starting from 0) as parameter.
var leftChannelData = buffer.getChannelData(0);
var rightChannelData = buffer.getChannelData(1);
Now, we can loop through the buffer and set each individual buffer’s element. The channel’s data is a view (Float32Array) on top of the buffer (ArrayBuffer). Each buffer’s element should have value between -1 and 1. As you may know sound is an air vibration. The faster (more frequent) the vibrations are, the higher the sound that we hear is. If you place the values for one sinusoidal oscillation in the buffer length and later for two oscillations, then the second one will be perceived as having a higher pitch (higher sound).
var data = buffer.getChannelData(0);
for (i = 0; i < data.length; i++) {
    data[i] = (Math.random() - 0.5) * 2; // Noise
    // In following lines I've presented various functions generating sound data (tones).
    // data[i] = Math.sin(1  * 180 * (i / data.length)); // One waveform oscillation
    // data[i] = Math.sin(2  * 180 * (i / data.length)); // Two waveform oscillations
    // data[i] = Math.sin(4  * 180 * (i / data.length)); // Four waveform oscillations
    // data[i] = Math.sin(8  * 180 * (i / data.length)); // Eight waveform oscillations
    // data[i] = Math.sin(16 * 180 * (i / data.length)); // Sixteen waveform oscillations
}
Finally, having prepared the buffer, we can use it in a SourceNode and play.
var buffer = context.createBuffer(1, 44100, 44100);
var data = buffer.getChannelData(0);
for (i = 0; i < data.length; i++) {
    /* Prepare data */
}

// Create source node
var source = context.createBufferSource();
source.loop = true; // Make sure that sound will repeat over and over again
source.buffer = buffer; // Assign our buffer to the source node buffer

// Connect to the destination and play
source.connect(context.destination);
source.noteOn(0);
Sample application
Having acquired the basic knowledge about all the elements used in the sample application we can now move to the part describing how it works. The picture below shows how the application looks.
 Fig. 2: The application screenshot
The application is divided into some sections, which are:
- Sound files – the list of sound files included in the application. If you want to try your own files you have to replace the corresponding files inside the application’s ‘sound’ directory,
- Synthesized sounds – two synthesized sounds, one using the OscillatorNode and the second by manually filling the AudioBuffer,
- Volume control – control of the sound volume,
- Playback rate – control how fast the sound is played,
- Filter/Equalizer – is the sound manipulation section, where you can choose between filters and equalizer panels or just disable any sound modifications. When the option is selected, the panel’s view will change and more options will appear. In the ‘Filter’ panel you can try each biquad filter and change its settings. In the ‘equalizer’ panel you can boost or attenuate the level of the given frequencies.
At the bottom of the application, there is a panel showing audio spectrum visualization. When the user plays a sound, you can stop it by clicking on the stop button that will appear over the audio spectrum panel. Let’s examine the most important parts of the application.
The application uses jQuery (version 1.8.2) and jQuery Mobile (version 1.3.0) libraries and their files are included in the head section. Additionally it uses the Tizen Lib library, more specifically its three modules:
- Logger – for logging errors, warnings etc.,
- Network – for checking if internet connection is available,
- View – for displaying the jQuery mobile loader.
I’m not going to describe how loading and playing sounds work because it was already covered in the previous article about the basis of the Web Audio API. You should get familiar with the previous article prior to reading this one.
The heart of the application is main.js file and ‘api’ module that has public interface that is almost the same as in the previous application. Comments describe it very well but there are two functions that are not present in the previously presented application. The ‘stopSound’ just stops playing any sound and the ‘generateAndPlaySound’ that generate sound using one of the methods. We will talk the details later.
Important private functions
In the previous application when playing sounds, we were just connecting nodes in a one way. In this application the routing graph can change depending on what options we choose. So we moved all the logic responsible for creating routing graph to the separate function.
_createRoutingGraph = function () {
    if (!_source) {
        return;
    }

    /* First disconnect source node form any node it's connected to.
     * We do it to make sure there is only one route in graph. */
    _source.disconnect(0);

    switch (_option) {
        case 'filters':
            _source.connect(_filterNode);
            break;
        case 'equalizer':
            _source.connect(_equalizerNodes[0]);
            break;
        case 'disabled':
            _source.connect(_gainNode);
            break;
    }
};
As you can see in the code above we connect the source node with the proper node depending on the value of the ‘_option’ variable. As I wrote before you can choose from three options: filter, equalizer or disabled. Unlike in the previous application, now source node is placed in scope of the ‘api’ module. I did that because we want to have a reference to the source node in any moment, for example to stop the sound which is playing. The ‘createRoutingGraph’ function should be executed when sound has to be played and when user changes the effect (filters/equalizer/disabled) he/she wants to use.
_isSoundPlaying() function
It’s one line function that first check if any source node was created. If it was, then we check the ‘playbackState’ property of the source. If it’s equal to PLAYING_STATE variable value that means the sound is playing.
_isSoundPlaying = function () {
    return _source && _source.playbackState === _source.PLAYING_STATE;
};
The _setPlaybackRate() function
This function increases or decreases the speed of a sound playback. The default value is 1 which means normal speed. 0 means that the sound has been stopped/paused. We first have to check if any sound is playing, if so, we check the existence of a ‘playbackRate’ property which is not present in all source nodes. The OscillatorNode, which is the source node doesn’t have that property. At the end we set a new value.
_setPlaybackRate = function (val) {
    /* Changing playback rate  */
    if (_isSoundPlaying()) {
        /* We have to check existence of playbackRate property in case of
         * OscillatorNode in which we can change that value. */
        if (_source.hasOwnProperty('playbackRate')) {
            _source.playbackRate.value = val;
        }
    }
};
The _playSound() function
At the beginning of the function we show the jQuery Mobile loader in the center of the screen to inform the user that sound processing takes place. We loop through all the loaded files and take one that matches the given name. Next, we stop sound if it’s playing. We create a SourceNode and put it in the private ‘_source’ variable that is visible across the ‘api’ module. Later, we have to create a routing graph and play the sound calling a ‘noteOn()’ function. At the end we hide the loader and call the ‘setPlaybackRate()’ function to make sure that the playing speed matches the current playback rate slider’s value. There can be a situation when the user changes the playback rate when no sound is playing, so we have to handle that. We can’t do it when the ‘_source’ variable is empty.
_playSound = function (name) {
    tlib.view.showLoader();

    /* Look for the sound buffer in files list and play sound from that buffer. */
    $.each(_files, function (i, file) {
        if (file.name === name) {
            _stopSound();

            /* Create SourceNode and add buffer to it. */
            _source = _context.createBufferSource();
            _source.buffer = file.buffer;
            /* Connect nodes to create routing graph. */
            _createRoutingGraph();
            _source.noteOn(0); // start()
            /* Set playback rate to a new value because it could be changed
             * while no sound was played. */
            _setPlaybackRate($('#playback-rate').val());
            tlib.view.hideLoader();

            return false;
        }
    });
};
The _stopSound() function
We check if there is any source sound data and call the ‘noteOff()’ function. Later we assign a null value to the ‘_source’ variable to get rid of the current source node.
_stopSound = function () {
    /* Check whether there is any source. */
    if (_source) {
        _source.noteOff(0); // stop()
        _source = null;
    }
};
Sound synthesis
The sound synthesis takes place in the ‘_generateAndPlaySound()’ function. As a parameter it takes function name to be used to generate sound. First, we have to check if a function with the given name exists in the private ‘_generationMethods’ object stored in the ‘app’ module. If so, we stop any sound that is playing. Next we invoke the specific method, create a routing graph and play the sound. The last thing we have to do is set a new value for the playback rate – the same thing we did in the ‘_playSound()’ function.
_generateAndPlaySound = function (name) {
    if (_generationMethods.hasOwnProperty(name)) {
        _stopSound();

        /* Generate sound with the given method. */
        _source = _generationMethods[name]();
        /* Connect nodes to create routing graph. */
        _createRoutingGraph();
        _source.noteOn(0); // start()
        /* Set playback rate to a new value because it could be changed
         * while no sound was played. */
        _setPlaybackRate($('#playback-rate').val());
    }
};
Let’s describe two generation methods that are stored in the ‘_generationMethods’ object.
Oscillator (_generationMethods.oscillator)
The oscillator method is very simple but we used only the basic properties of the OscillatorNode. As I wrote at the beginning of this article, if you are advanced in the sound synthesis, you would probably make use of the all oscillator’s functions.I set the type of the oscillator’s wave to ‘triangle’, set the frequency to 100 Hz and detune the sound by 400 Cents. The method returns the created source node.
_generationMethods.oscillator = function generateSoundWithOscillator() {
    var source;

    source = _context.createOscillator();
    source.type = source.TRIANGLE; /* 0 - Sine wave, 1 - square wave, 2 - sawtooth wave, 3 - triangle wave */
    source.frequency.value = 100;
    source.detune.value = 400;

    return source;
};
Manual (_generationMethods.manual)
The manual method uses a buffer that we fill with data to create noise. We set the buffer’s size to 44100 and its playback rate to 44100 which means that all 44100 sample-frames will be played in one second. We set the first argument of the ‘createBuffer()’ function to 1, which refers to 1 channel (mono sound). We get this channel data.
buffer = _context.createBuffer(1, 44100, 44100);
data = buffer.getChannelData(0);
The next thing we do is fill the buffer. We loop through all elements and apply to each one the result of the function:
(Math.random() – 0.5) * 2.
The ‘random()’ function generates values between 0 and 1 and one sample-frame can have values between -1 and 1 so we want to expand the random value to the sample-frame range. If you imagined the ‘random()’ function graph in the X/Y coordinate system, the first thing is to lower the graph down by 0.5 and then multiply its values by 2 to expand them to the <-1;1> range.
for (i = 0; i < data.length; i++) {
    data[i] = (Math.random() - 0.5) * 2;
}
Next, we create a SourceNode and set the created data as its buffer. We also have to set a loop property to true to play the sound longer than one second.
source = _context.createBufferSource();
source.loop = true;
source.buffer = buffer;
Sound visualization
As I wrote at the beginning of this article, sound visualization can be created with the use of the AnalyserNode. We have to call one of the three functions that retrieve sound data. There is no listener that we can bind to, so we have to manually invoke the data function after a specified time interval. To do that, we use a timer that we run when the application starts.
_startTimer = function () {
    /* Draw sound wave spectrum every 10 milliseconds. */
    _timer = setInterval(_timerFunction, 10);
};
And stop it when the application is closed.
_stopTimer = function () {
    /* Reset timer for drawing sound wave spectrum. */
    if (_timer) {
        clearInterval(_timer);
        _timer = null;
    }
};

/* ... */

/* onAppExitListener stops visualization timer and exits application. */
onAppExitListener = function () {
    _stopTimer();
    tizen.application.getCurrentApplication().exit();
};
The ‘_timerFunction’ is called every 10 milliseconds. It redraws the sound spectrum and checks if any sound is playing. If so, it displays the ‘stop’ button over the spectrum and hides it otherwise.
_timerFunction = function () {
    _draw();
    if (_isSoundPlaying()) {
        $('#stop').show();
    } else {
        $('#stop').hide();
    }
};
A spectrum drawing process takes place in the ‘_draw()’ function. To draw the audio spectrum, we use a canvas element. We can’t display bars for all the frequencies in the spectrum because there is not enough space on the screen. We have to omit some frequencies. In the drawing function we have some variables needed to calculate how many bars (barCount) we are able to display. First we specify one bar width (barWidth) and the spacing (barSpacing) between adjacent bars and having the screen width (width) we can calculate the bars count. Next we have to know how many elements of a buffer we should omit (loopStep) when going through the ‘for’ loop.
In addition I decided to colorize the spectrum bars depending on how loud a given frequency is. Higher intensity makes the bar reddish, and lower intensity makes it greenish. I used the HSL color model because it’s easy to change only the color and keep the lightness and saturation at the same level. The only thing left to do is positioning the bar in the canvas.
_draw = function () {
    var canvas, context, width, height, barWidth, barHeight, barSpacing, frequencyData, barCount, loopStep, i, hue;

    canvas = $('canvas')[0];
    context = canvas.getContext('2d');
    width = canvas.width;
    height = canvas.height;
    barWidth = 10;
    barSpacing = 2;

    context.clearRect(0, 0, width, height);
    frequencyData = new Uint8Array(_analyserNode.frequencyBinCount);
    _analyserNode.getByteFrequencyData(frequencyData);
    barCount = Math.round(width / (barWidth + barSpacing));
    loopStep = Math.floor(frequencyData.length / barCount);

    for (i = 0; i < barCount; i++) {
        barHeight = frequencyData[i * loopStep];
        hue = parseInt(120 * (1 - (barHeight / 255)), 10);
        context.fillStyle = 'hsl(' + hue + ',75%,50%)';
        context.fillRect(((barWidth + barSpacing) * i) + (barSpacing / 2), height, barWidth - barSpacing, -barHeight);
    }
};
Filters and the equalizer
Filters are very simple to implement. It’s just one BiquadFilterNode that has some sliders connected to its properties. We can change the filter type, frequency, quality and gain properties.
The equalizer needs more attention. It consists of six BiquaFilderNode’s connected to one line/graph.
_equalizerNodes = [
    _context.createBiquadFilter(),
    _context.createBiquadFilter(),
    _context.createBiquadFilter(),
    _context.createBiquadFilter(),
    _context.createBiquadFilter(),
    _context.createBiquadFilter()

];

_equalizerNodes[0].connect(_equalizerNodes[1]);
_equalizerNodes[1].connect(_equalizerNodes[2]);
_equalizerNodes[2].connect(_equalizerNodes[3]);
_equalizerNodes[3].connect(_equalizerNodes[4]);
_equalizerNodes[4].connect(_equalizerNodes[5]);
_equalizerNodes[5].connect(_gainNode);
Each filter’s type is set to PEAKING. The quality we set to 2 and the only property we can manipulate with the equalizer’s sliders is ‘gain’. We can change the gain value between -50 and 50, attenuating or boosting the given frequency. And talking about frequencies we have to mention why consecutive elements have such values and not others. It’s because of a logarithmic scale in which the frequency spectrum is presented.
_equalizerNodes[0].frequency.value = 50;
_equalizerNodes[1].frequency.value = 160;
_equalizerNodes[2].frequency.value = 500;
_equalizerNodes[3].frequency.value = 1600;
_equalizerNodes[4].frequency.value = 5000;
_equalizerNodes[5].frequency.value = 20000;
Summary
The subject covered in this article is an introduction to advanced sound manipulation and synthesis. It explains how to use the Web Audio API for more advanced tasks. You can use that knowledge and write a sound player with audio spectrum visualization and an equalizer.
Was this document helpful?
We value your feedback. Please let us know what you think.