Measuring performance in Tizen multimedia applications
PUBLISHED
Introduction
One of the most important issues in multimedia and game programming for any platform is the ability to measure the performance of your code on devices. You can do it by using diagnostic tools like profiling managers (for example in the Google Chrome browser) or by using third party libraries dedicated to the measurement of efficiency.
This article will describe how to write your own FPS (frame per second) counter and how to apply it to the pixi.js WebGL rendering engine. We will also show three other measurement tools that you can use to measure any bottlenecks and performance problems on your test devices. Please note that this article is accompanied with a Tizen fpsmeter.wgt sample application which presents a working demo of the pixi.js engine combined with our FPS meter and three other performance measurement libraries described in this article. The fpsmeter.wgt sample application (fig. 1) has been tested on the Tizen SDK 2.3.
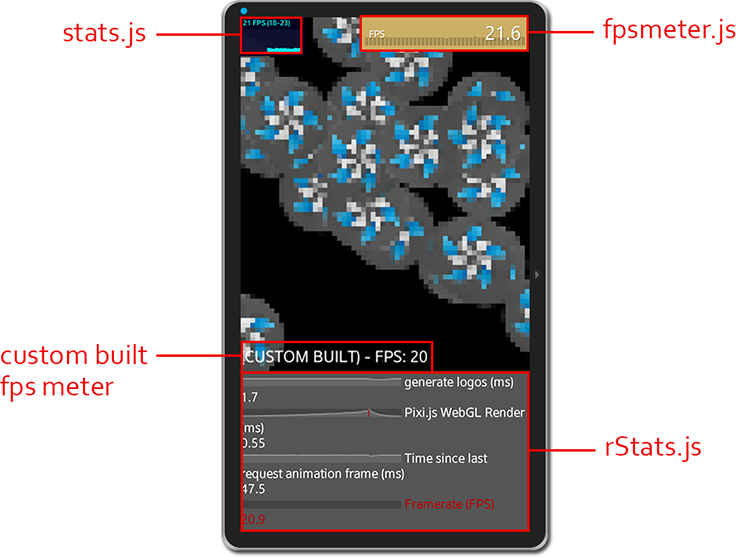
Figure 1 – preview of the fpsmeter.wgt with the highlighted meters of the performance measuring libraries described in this article.
Writing your own JavaScript FPS counter
You can create a measurement tool basing on FPS measuring in minutes. All you need to do is to identify the specific parts of your game / multimedia application. You must see in your application code where you declare your variables, then where you instantiate the main visual elements of your application and finally where is located the render loop. Having done that you can quickly implement a custom built fps meter as shown above (fig. 1).
The first thing to do is to declare variables we will need to use in our project. You can find the description of each variable in the comments below.
[…]

var fpsText;              // the Pixi.js PIXI.Text(); // our text field in Pixi.js

var fpsTimer;             // this variable will hold our setInterval method

var fps;                  // this variable will hold the current FPS count
var filterStrength = 20;  // the low pass filter strength
var frameTime = 0;        // the current frame time in miliseconds
var lastLoop = new Date;  // the last "count tick" of our counter
var thisLoop;             // the latest "count tick" of our counter

[…]
The next step in creating our custom FPS meter is to instantiate a text field using pixi.js and create a setInterval() function which will be invoked every second to display the changing FPS on the screen.
[…]

       fpsText = new PIXI.Text("(CUSTOM BUILT) - FPS: ", {font:"20px Arial", fill:"white"});
       fpsText.position.y = stageHeight - 30;

	   fpsTimer = setInterval(updateFps, 1000);

	   function updateFps() {

		   if (fps != null)
		   {
			   fpsText.setText("(CUSTOM BUILT) - FPS: " + Math.floor(fps));
		   }

	   }
[…]

       stage.addChild(fpsText);

[…]
The last step to make our FPS counter work is to put into the render loop of your game or multimedia application the following code. Basically what this code does is counting the time between the calls of the Date object and then filtering the result with the filterStength variables’ value. Finally it supplies the fps variable with the current FPS count, ready to display on the screen. Now you are ready to implement the code and check the FPS in your application.
[…]

    var thisFrameTime = (thisLoop = new Date) - lastLoop;
        frameTime += (thisFrameTime - frameTime) / filterStrength;
	lastLoop = thisLoop;
	fps = (1000/frameTime).toFixed(1);

[…]
External performance measuring libraries
Mrdoob / stats.js
Our little FPS counter is of course only an example how you can measure performance of your multimedia applications. The web is full of great performance measuring libraries. One of them is the famous stats.js by mrdoob. The library was originally developed for the flash platform. But since the fading of flash mrdoob has ported the library to JavaScript and therefore we can utilize it now in our projects. The main advantage of using stats.js is its ease of use, simplicity and a nice look. It works in two modes. The FPS measuring mode and the milliseconds mode. You can switch between both by clicking or tapping the onscreen performance graph. The easiest way to implement stats.js in your project is to first add the library in the <script> tag in your HTML5 index file. Then use the following code.
[…]

       var stats;

[…]
    	// Initiate the stats.js object.
           stats = new Stats();
	   	   stats.setMode(0); // 0 – use the FPS mode, 1 – use the milliseconds mode

		// Position the meter in the top-left corner
		   stats.domElement.style.position = 'absolute';
		   stats.domElement.style.left = '0px';
		   stats.domElement.style.top = '0px';

		// Append the meter to the body of your HTML5 document.
	           document.body.appendChild( stats.domElement );
[…]
Having set up the library you can put into your render loop the following measurement code.
[…]

draw();

function draw() {
    stats.begin();

	// the rendering code goes here
	requestAnimationFrame(draw);

    stats.end();
}

[…]
As you can see above everything between stats.begin() and stats.end() in the render loop will be taken under measurement in calculating the burden for the processor and the final FPS count. More information about this library can be found at https://github.com/mrdoob/stats.js/. Please familiarize yourself with this page in order to make the most out of this simple, yet very useful library.
Fpsmeter.js
Another great measuring library is the fpsmeter.js. This library has many graphical options, so you can easily tweak the looks of the meter. It can measure frames per second, the number of milliseconds between frames and number of milliseconds it takes to render one frame. Traditionally you have to add the library to your Tizen project using the HTML5 <script> tag. Then beneath you can find an example how to setup fpsmeter.js in your JavaScript code along with suitable comments .
[…]

var meter = new FPSMeter({
                interval:  100,     // Update of the fpsmeter.
	        smoothing: 10,      // The readout smoothing strength.
                show:      'fps',   // switiching between ‘fps’ mode and milliseconds – ‘ms’ mode
	        toggleOn:  'click', // the event which will toggle
                                    // the change between ‘fps’ and ‘ms’ modes;
                decimals:  1,       // Number of decimals in FPS measurement.
                maxFps:    60,      // The maximum FPS value that can be displayed in the meter.
	        threshold: 100,     // Minimal tick interval to report in milliseconds.

  // The CSS positioning of the fpsmeter.
	        position: 'absolute',
	        zIndex:   10,
                left:     '150px',
	        top:      '0px',
	        right:    'auto',
	        bottom:   'auto',
	        margin:   '0 0 0 0',

  // Display
	        theme: 'colorful', // The Display theme. You can choose from:
                                   // 'light', dark, 'colorful' and transparent.
	        heat:  1,          // Should the color themes use the heat
                                   // colours of the current fps value.

  // The graph options
	        graph:   1, // 0 – turn off history graph,
                            // 1 – turn on history graph.
	        history: 40 // Number of FPS states to be shown on the graph.

	    });
[…]
With the fpsmeter you can measure FPS by using the meter.tick() at the end of each rendered frame or you can check how long a frame takes to render. In this case use meter.tickStart() in the beginning of the frame and meter.tick() at the end of the frame. There are also many other options worth checking. We recommend to check the fpsmeter.js home page ( http://darsa.in/fpsmeter/ ) to obtain additional information about this library.
rStats.js
It is also worth to mention the rStats.js library. Although it is in its 0.1 version, but still it gives a lot of useful information and can be nicely customized for your needs. It has the option to measure any part of the code in terms of performance. It also has an ability to produce stacked area charts of the running processes. You can also change the labels, create additional counters and graphs. Finally you can group the graphs thematically and set off alarms if the measured value drops under certain value or goes above some other value. The basic setup of the library is very simple, you just need to add the library script in the HTML5 <script> tag. Then initialize the library object and set the labels. You can also use the over and below parameters in order to set off alarms for specific values when passed.
[…]

rS = new rStats({
           values: {
               raf: { caption: ' Time since last request animation frame (ms)' },
               fps: { caption: ' Framerate (FPS)' , below: 40 },
               action1: { caption: ' Render action #1 (ms)' },
               render: { caption: ' Pixi.js WebGL Render (ms)', over: 16 }
           }
       });

[…]
The last thing to do is to put some measuring code in the render loop. Below you can see how a part of code between rS( 'render' ).start() and rS( 'render' ).end() is measured. Also please note that you can measure the time passed between animation frames with rS( 'rAF' ).tick(). And the frame per second count is measured using rS( 'FPS' ).frame(). At the end, in order to change the displayed values, you need to update the rStats meter with the rS().update() function.
[…]

draw();

function draw() {

       rS( 'render' ).start();

	 // Your rendering code goes here!
	    renderer.render(stage);
	    requestAnimationFrame(draw);

       rS( 'rAF' ).tick();

    rS( 'render' ).end();

    rS( 'FPS' ).frame();
    rS().update();

}

[…]
The rStats.js has many other useful features. This article has only described the simplest usage of the library. Please feel free to read more at the official web page of this library at http://spite.github.io/rstats/.
Summary
This article describes the means and tools for performance measuring in Tizen applications. We have showed how to create a custom FPS meter. Also we described three external libraries which can measure performance of your Tizen web projects. Therefore helping you find bottlenecks and improving the user experience of your applications. We hope that this article will help you in your daily work with multimedia projects. Feel free to experiment with the sample application attached to this article in order to get different results in performance measurement.