Debugging the Project
PUBLISHED
Before you can debug your application, you must install the required software:
- Install the cross-platform gdb with the following command:
sudo apt-get install gdb-arm-none-eabiIf there is a conflict with the previous gdb, remove the old gdb first using the
sudo apt-get remove gdbcommand, and only installgdb-arm-none-eabi. - Install the dependable modules with the following command:
sudo apt-get install gperf libncurses5-dev flex bison
To debug the application:
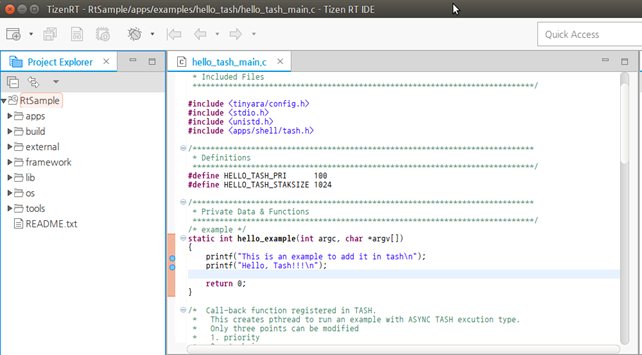
- Set the needed break points by clicking the left side of the Code Editor:
- In the Project Explorer view, select the project.
- To debug the project, use one of the following:
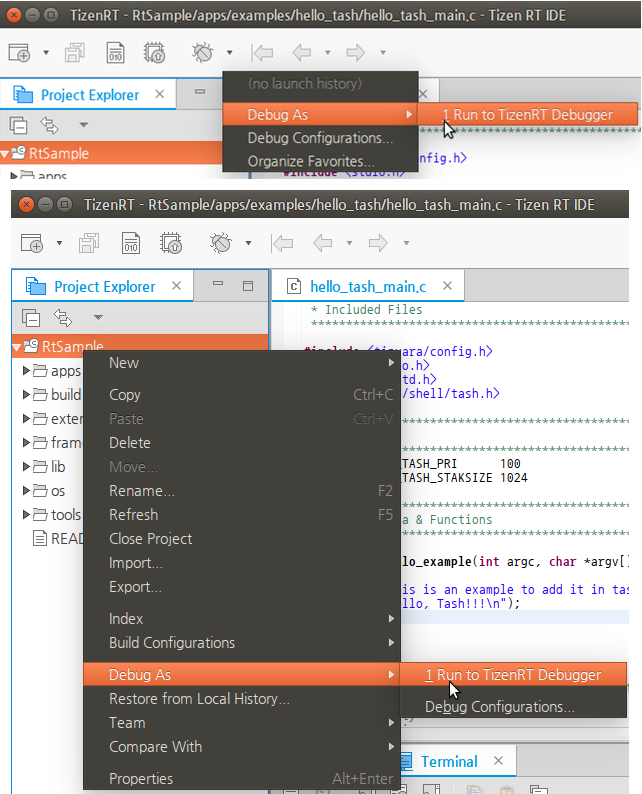
- In the Tizen Studio for RT menu, select Run > Debug As > Run to TizenRT Debugger.
- In the Tizen Studio for RT toolbar, click the Debug icon (
 ) drop-down list, and select Debug As > Run to TizenRT Debugger.
 - Right-click the project in the Project Explorer view, and select Debug As > Run to TizenRT Debugger.
- In the Select GDB Client Binary dialog box select the path where
arm gdbis installed, and click OK:
Note gdb installation path can be found using the commandwhich arm-none-eabi -gdbin terminal.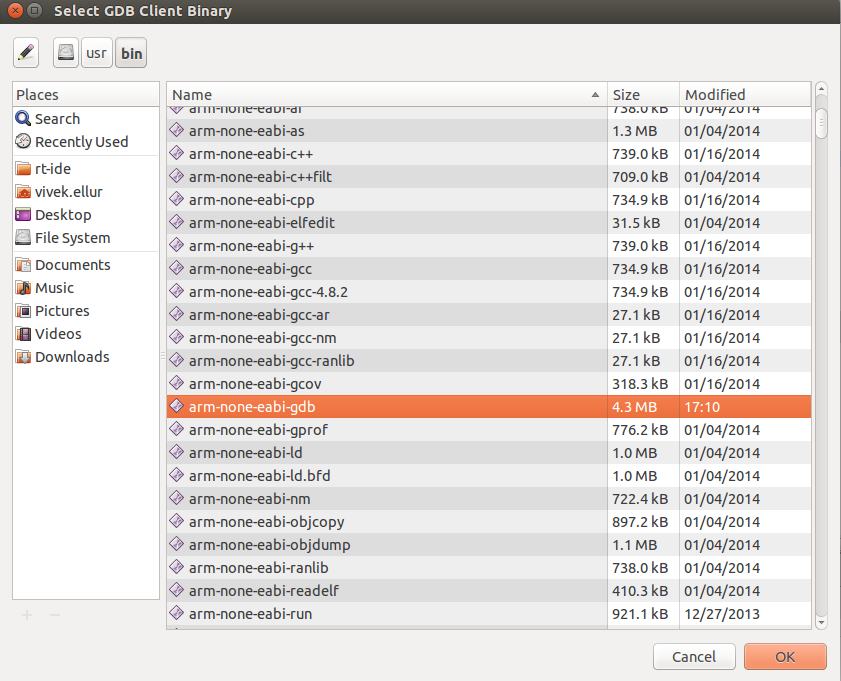
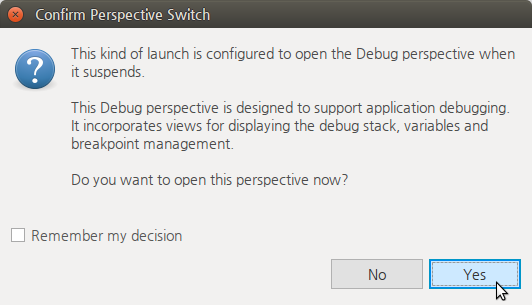
- Before the debugging starts, the Confirm Perspective Switch dialog box is shown. Click No, and add Source Mapping before proceeding to debug perspective:
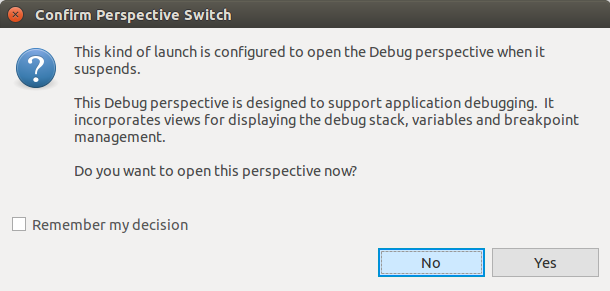
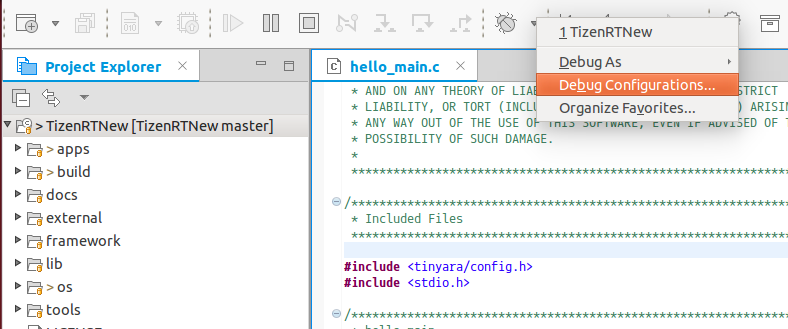
- To add Source Mapping, click Debug Configurations in the debug drop-down list:
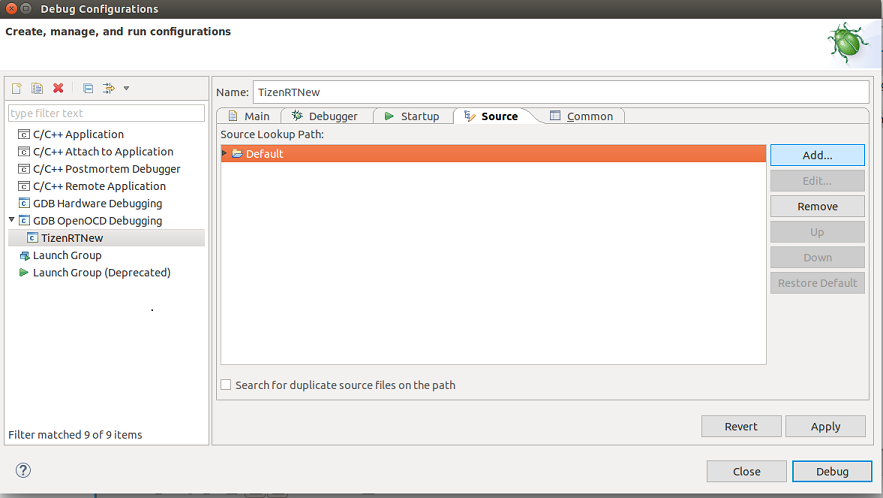
- Expand the GDB OpenOCD Debugging from the list in the left, and select the available configuration. Select the Source tab, and click Add:
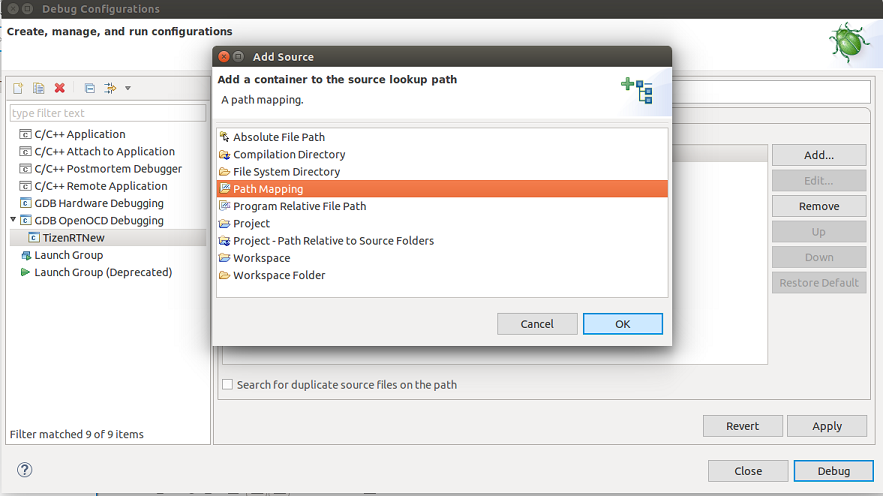
- Select Path Mapping option from the Add Source dialog box:
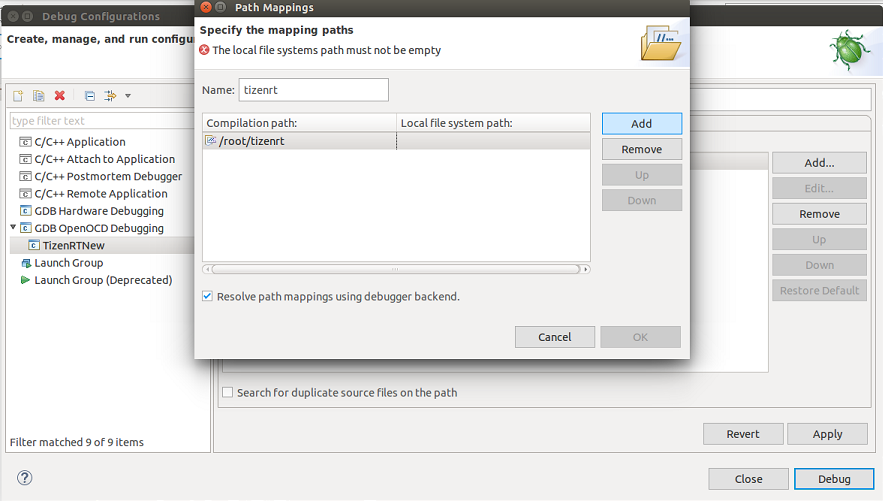
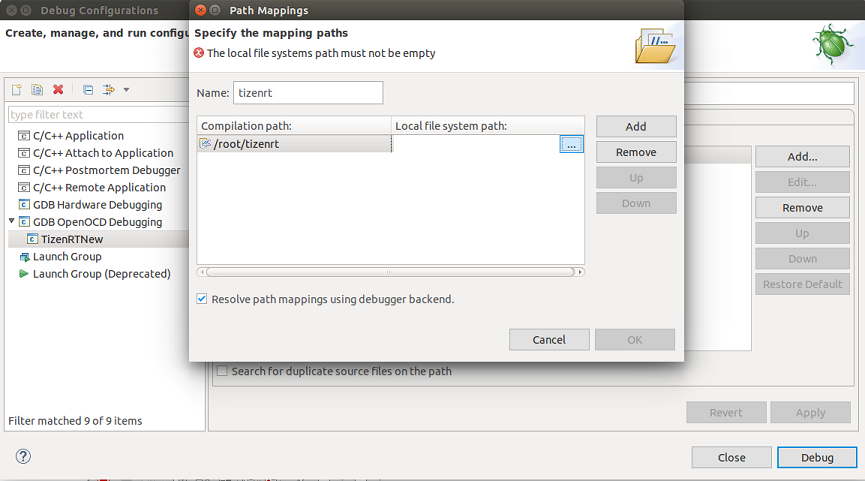
- In the Path Mapping dialog click Add, and enter the name for new path mapping:
- In the Configuration Path, add
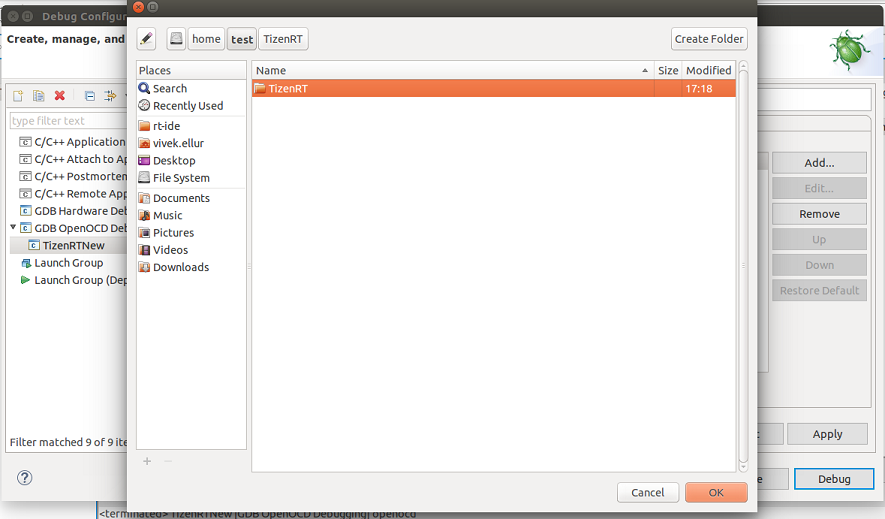
/root/tizenrtas path. - In the Local file system path, select the path where the TizenRT platform code is present.
- In the Configuration Path, add
- Click OK after the TizenRT platform code has been selected:
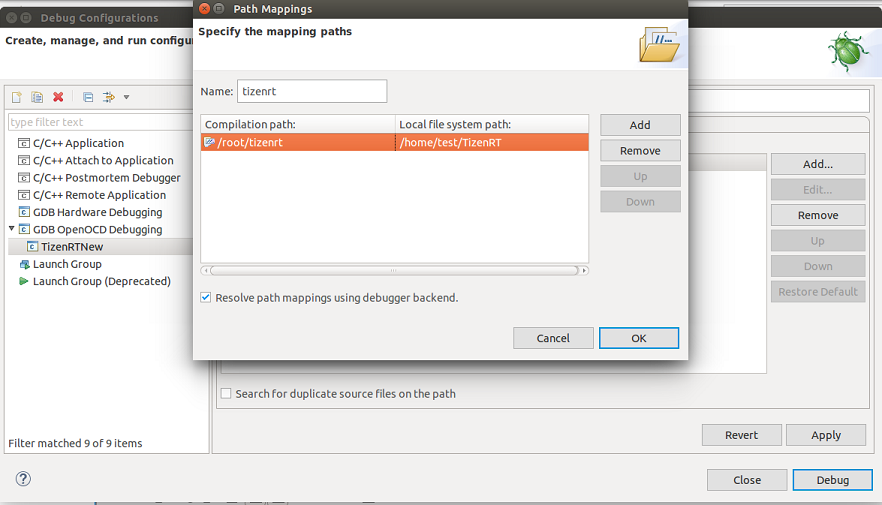
After, you have added the path mapping, you can see the new path mapping entry in source tab:
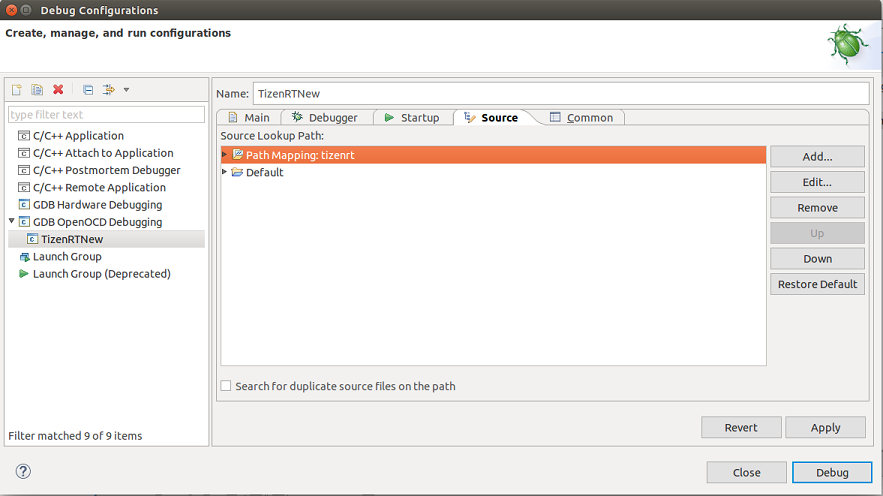
After path mapping has been added, click Debug to start debugging.
Confirm Perspective dialog box is shown, to switch to the Debug perspective, click Yes:
The Debug perspective shows the views useful for debugging activities, organized in the optimal fashion within the Tizen Studio window:
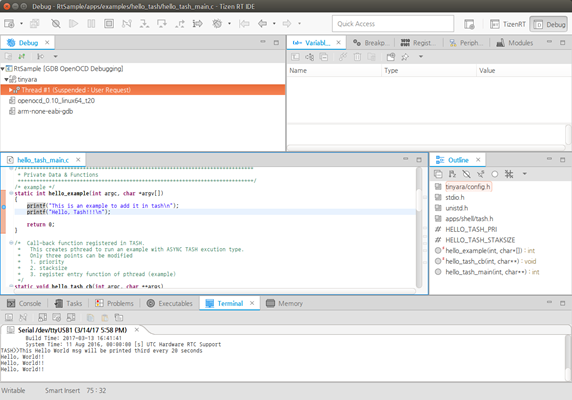
When an action is executed on the board and it passes through a break point, the line is in the suspended state (see the figure above):
You can perform various debugging functions (such as resume, step into, and step over) by using the toolbar in the Debug perspective:
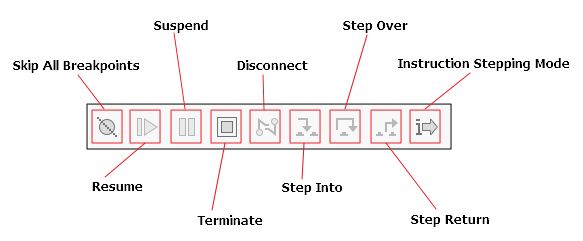
When working with only one debugger instance, you must stop the previously running debugging operation to start a new debugging operation.
If you run more than one debugger at the same time, you get an error.
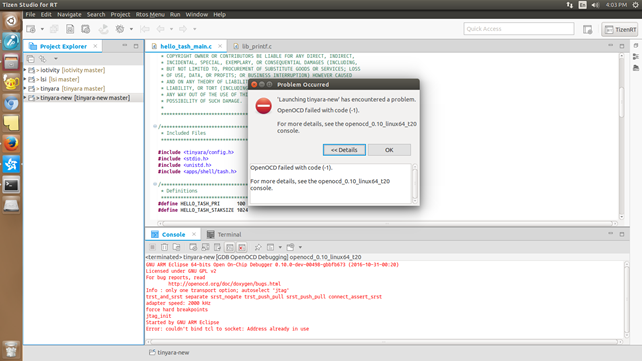
Figure: Error when trying to run multiple debuggers
