Leaflet Maps on tizen
PUBLISHED
Overview
This article demonstrates displaying of maps using Leaflet.js javascript library. It is an open source library for mobile friendly interactive maps. It works efficiently across all major desktop and mobile platforms using HTML5 and CSS3.
Prerequisites
The following open source javascript library and Leaflet CSS file has to be included in the head section of html page.
<script src="http://cdn.leafletjs.com/leaflet-0.6.4/leaflet.js"></script>
<link rel="stylesheet" href="http://cdn.leafletjs.com/leaflet-0.6.4/leaflet.css" />
To use Leaflet maps in 'Tizen' add below lines in config.xml file.
<access origin="http://cdn.leafletjs.com" subdomains="true"/>
<access origin="http://tile.cloudmade.com" subdomains="true"/>
HTML page
This page contains a div element with an id to display the map.
<div data-role="content">
  <div id="map"></div>
</div>
JavaScript
In order to display maps below steps have to be followed
Intializing map
Initialize the map and set its view to certain geographical coordinates and a zoom level.
var map = L.map('map').setView([17.3660, 78.4760], 13);Here the function L.Map ( id, Map options ) intializes a map object, where the first parameter is an id of div element and the second parameter is 'map options' which is optional. Another function setView ( center, zoom, zoom/pan options ) sets the view of the map (geographical center and zoom) with the given animation options.
Adding Tile Layer
Tile Layer is used to load and display layers on the map. User has to register at Cloudmade to use 'Tile Layers'.
L.tileLayer('http://{s}.tile.cloudmade.com/{key}/{styleId}/256/{z}/{x}/{y}.png', {
    key: 'API-key',
    styleId: 997
}).addTo(map);
Here the function L.TileLayer( urlTemplate, TileLayer options ) creates a tile layer object, where the first parameter is URL template and the second parameter is 'TileLayer options' which is optional.
Adding Markers, Circles, Polygons on the map
Markers
The function L.Marker ( LatLng, Marker options ) creates a Marker object with geographical point and 'Marker options'(optional) as parameters .
var marker = L.marker([17.3660, 78.4760]).addTo(map);
Circles
The function L.Circle ( LatLng, radius, Path options ) creates a circle object with geographical point, radius (in meters) and 'Path Options'(optional) as parameters.
var circle = L.circle([17.435943700000000000, 78.341673099999980000], 500, {
    color: 'red',
    fillColor: '#f03',
    fillOpacity: 0.5
}).addTo(map);
Ploygons
The function L.Polygon( LatLng, Polyline options ) creates a polygon object with an array of geographical points and 'Polyline options'(optional) as parameters.
var polygon = L.polygon([
    [17.31918, 78.52066],
    [17.27066, 78.57971],
    [17.36375, 78.62091]
]).addTo(map);
Dealing with Popups
Popups are used to attach some information to a particular object on a map.
marker.bindPopup("Hi, This is a popup.").openPopup();
circle.bindPopup("This is a circle.");
polygon.bindPopup("This is a polygon.");
The 'bindPopup' method attaches a popup with the specified content to the marker, so the popup appears when you click on the object. The 'openPopup' method (for markers only) immediately opens the attached popup.
Events
Events allow user to execute some function when something happens with an object (e.g. the user clicks on the map).
function onMapClick(e) {
    alert("You clicked the map at " + e.latlng);
}
map.on('click', onMapClick);
Defining own Icons for markers
The function L.Icon( Icon options ) creates icon instance with the given options.
var sampleIcon = L.icon({
    iconUrl: 'icon1.png',
    shadowUrl: 'icon_shadow.png',

    iconSize:     [38, 95], // size of the icon
    shadowSize:   [50, 64], // size of the shadow
    iconAnchor:   [22, 94], // point of the icon which will correspond to marker's location
    shadowAnchor: [4, 62],  // the same for the shadow
    popupAnchor:  [-3, -76] // point from which the popup should open relative to the iconAnchor
});
Add 'sampleIcon' to map using 'addTo()' function.
L.marker([17.31918, 78.52066], {icon: sampleIcon}).addTo(map);Icon class
If an user wants to place multiple icons on map then he has to define his own icon class containing the shared options, inheriting from 'L.Icon'.
var sampleIcon = L.Icon.extend({
    options: {
        shadowUrl: 'icon1.png',
        iconSize:     [38, 95],
        shadowSize:   [50, 64],
        iconAnchor:   [22, 94],
        shadowAnchor: [4, 62],
        popupAnchor:  [-3, -76]
    }
});
Create Icons for the above class.
var firstIcon  = new sampleIcon({iconUrl: 'icon1.png'}),
    secondIcon = new sampleIcon({iconUrl: 'icon2.png'}),
    thirdIcon  = new sampleIcon({iconUrl: 'icon3.png'});
Add markers with above icons to map.
var City1=L.marker([17.3615505, 78.47475039999995], {icon: firstIcon}).addTo(map).bindPopup("Icon1");
    City2=L.marker([17.522695, 78.35658969999997],  {icon: secondIcon}).addTo(map).bindPopup("Icon2");
    City3=L.marker([17.2366597, 78.42973180000001], {icon: thirdIcon}).addTo(map).bindPopup("Icon3");
Layer Group
Instead of adding the above markers(Icons) to map sepearately, use LayerGroup() method to add all markers at once.
var Cities = L.layerGroup([City1, City2, City3, City4]);
Layers Control
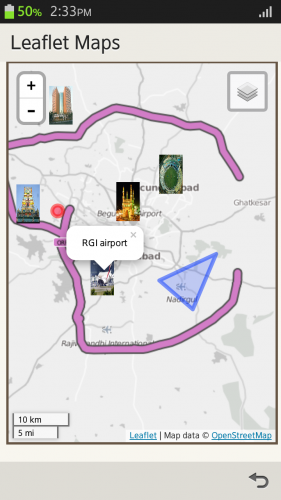
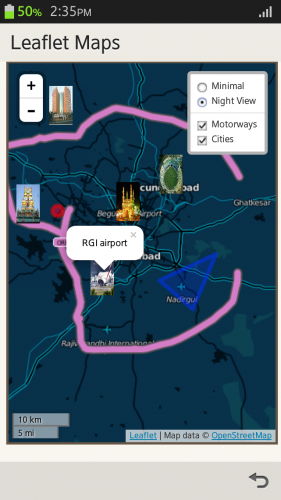
Leaflet.js allows users to switch between the layers(eg: one layer shows minimal view and the other shows night view ) of map. Leaflet maps provide two types of layers - base layers that are mutually exclusive (only one can be visible on map), e.g. tile layers and overlays (all the other stuff placed over the base layers). In this article, two base layers (minimal and night-style base map) to switch between, and two overlays(a pink motorways overlay and city markers) to switch on and off are explained.
var cloudmadeUrl = 'http://{s}.tile.cloudmade.com/API-key/{styleId}/256/{z}/{x}/{y}.png';,

var minimal   = L.tileLayer(cloudmadeUrl, {styleId: 22677}),
    midnight  = L.tileLayer(cloudmadeUrl, {styleId: 999}),
    motorways = L.tileLayer(cloudmadeUrl, {styleId: 46561});

var map = L.map('map', {
    center: new L.LatLng(17.3660, 78.4760),
    zoom: 10,
    layers: [minimal, motorways, cities]
});
Create two objects, one will contain 'base layers' and the other will contain 'overlays'.
var baseMaps = {
    "Minimal": minimal,
    "Night View": midnight
};

var overlayMaps = {
    "Motorways": motorways,
    "Cities": cities
};
Create a Layers Control and add it to the map. The first argument passed when creating the layers control is the base layers object. The second argument is the overlays object. Both arguments are optional - for example, just pass a base layers object by ommiting the second argument, or just an overlays objects by passing null as the first argument.
L.control.layers(baseMaps, overlayMaps).addTo(map);
References
Screen shots
Minimal view
Night view


