Debugging the Project
PUBLISHED
Before you can debug your application, you must install the required software:
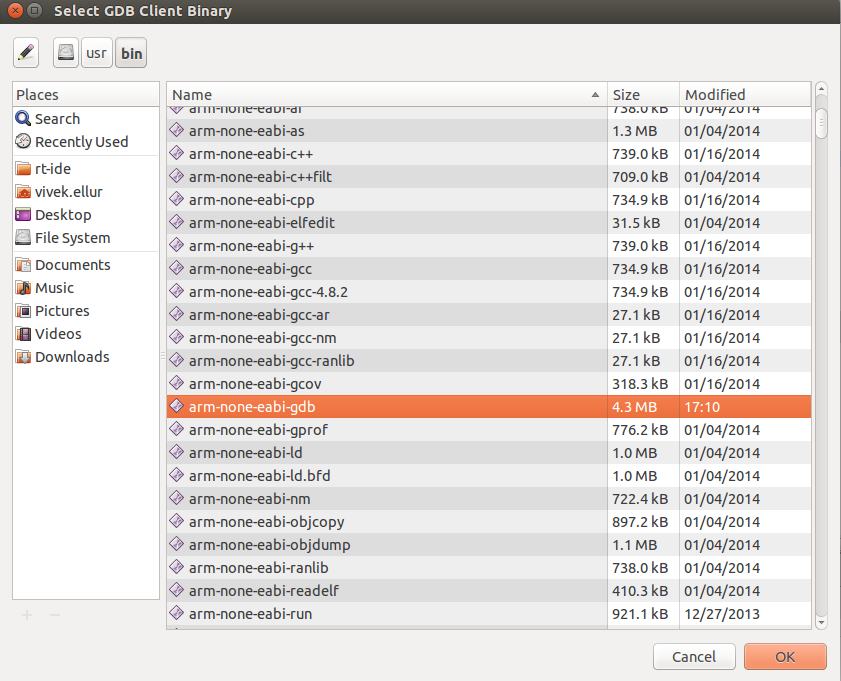
- Install the cross platform gdb with the following command:
sudo apt-get install gdb-arm-none-eabiIf there is a conflict with the previous gdb, remove the old gdb first using the
sudo apt-get remove gdbcommand, and only then install gdb-arm-none-eabi. - Install the dependable modules with the following command:
sudo apt-get install gperf libncurses5-dev flex bison
To debug the application:
- Set the needed break points by clicking the left side of the Code Editor.
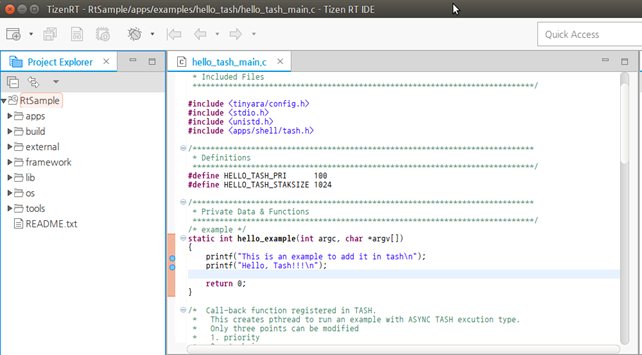
- Select the project in the Project Explorer view.
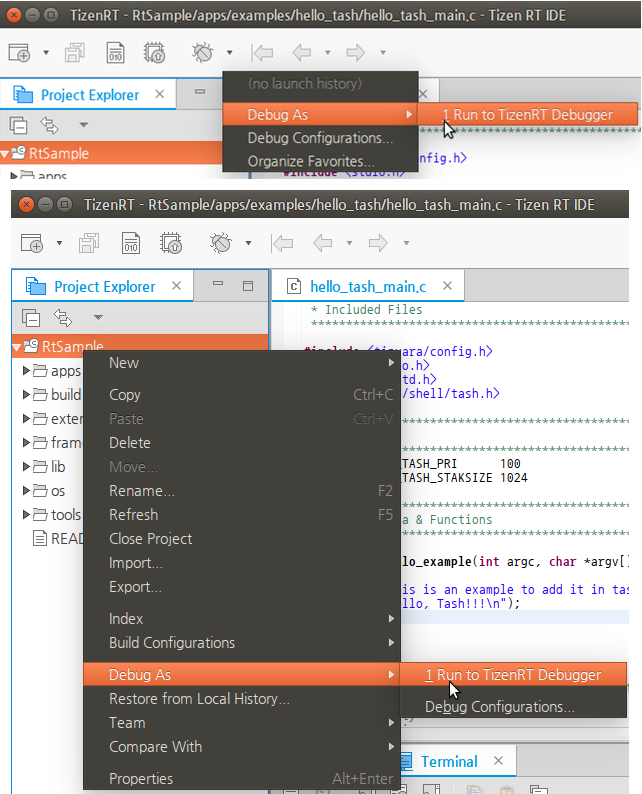
- To debug the project, use one of the following:
- In the Tizen Studio for RT menu, select Run > Debug As > Run to TizenRT Debugger.
- In the Tizen Studio for RT toolbar, click the Debug icon (
 ) drop-down list, and select Debug As > Run to TizenRT Debugger.
 - Right-click in the Project Explorer view, and select Debug As > Run to TizenRT Debugger.
- In the debug config select dialog, select a debug flashing option and click OK.
- Before the debugging starts, the Confirm Perspective Switch dialog is shown.
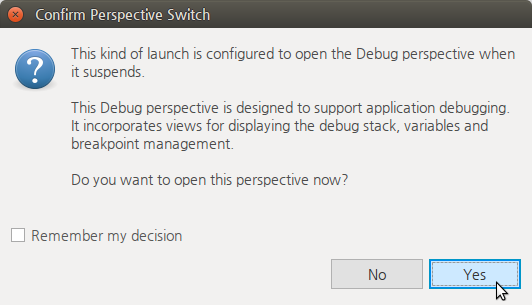
To switch to the Debug perspective, click Yes.
The Debug perspective shows the views useful for debugging activities, organized in the optimal fashion within the Tizen Studio window.
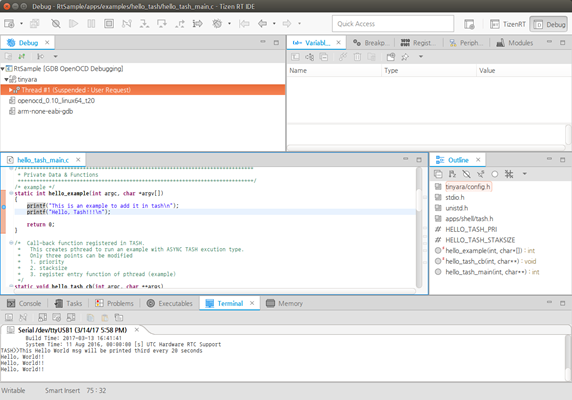
When an action is executed on the board and it passes through a break point, the line is in the suspended state (see the figure above).
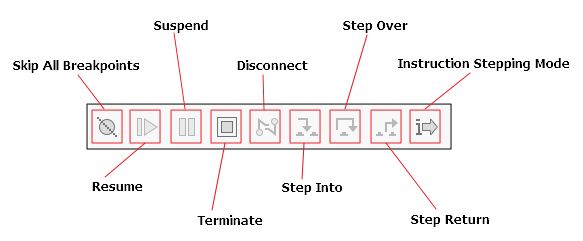
You can perform various debugging functions (such as resume, step into, and step over) by using the toolbar in the Debug perspective.
When working with only 1 debugger instance, you must stop the previously running debugging operation to start a new debugging operation.
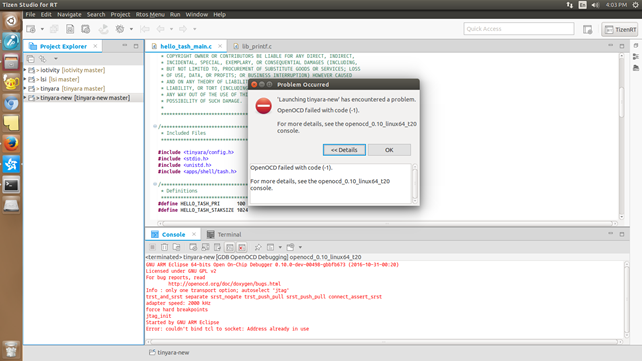
If you run more than 1 debugger at the same time, you get an error.
Figure: Error when trying to run multiple debuggers
