Debugging a Project
PUBLISHED
To debug an application:
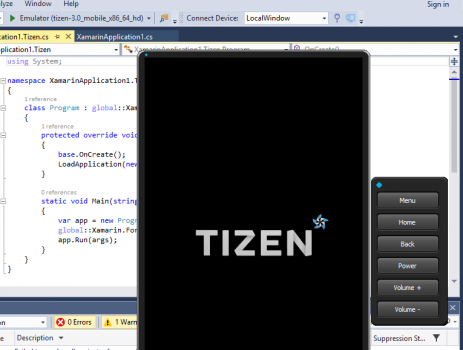
- Run the emulator in Tools > Tizen > Run Emulator, or click Launch Tizen Emulator.

Wait for the emulator to launch.
The Launch Tizen Emulator button changes to Emulator (tizen-3.0_mobile_x86_64_hd).
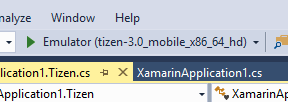
- Start debugging.
The debug functionalities are still in development.
- You can pause the code with a break point and see primitive values, such as an integer.
Add a breakpoint using the F9 key.

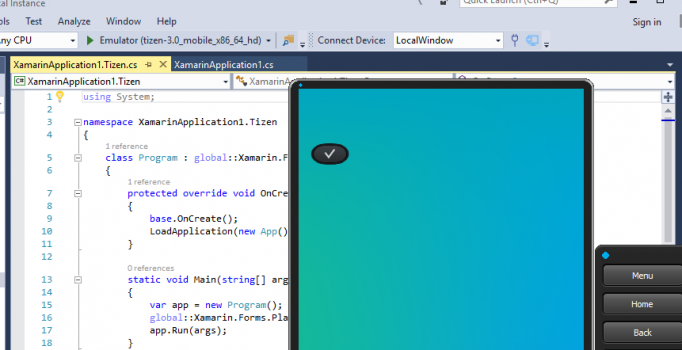
- Click Debug Start in the Emulator (tizen-3.0_mobile_x86_64_hd) view.
- Visual Studio builds the project if you have not built it or it needs building.
- The Tizen package file (
.tpk) must be installed after the build:

- If no changes were made, the installation does not happen.
- If you changed the connection with the device (emulator), the installation happens.
- The code pauses at the break point.

- Click Continue.
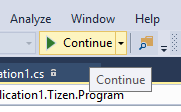
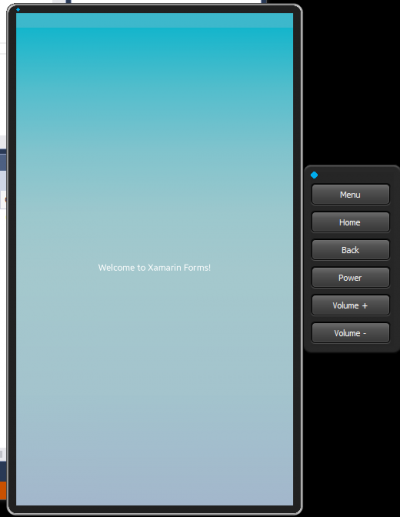
The application continues running on the emulator.
- Click Back on the emulator or Stop Debugging in Visual Studio to end the debugging process.


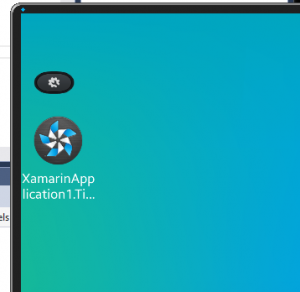
After the debugging is done, your application is available in the emulator and can be run again, as needed.
- You can pause the code with a break point and see primitive values, such as an integer.

