

Dynamic Analyzer
You can monitor the performance and reliability of your Native application on a target device or the Emulator by running the dynamic analyzer tool included within the Tizen SDK.
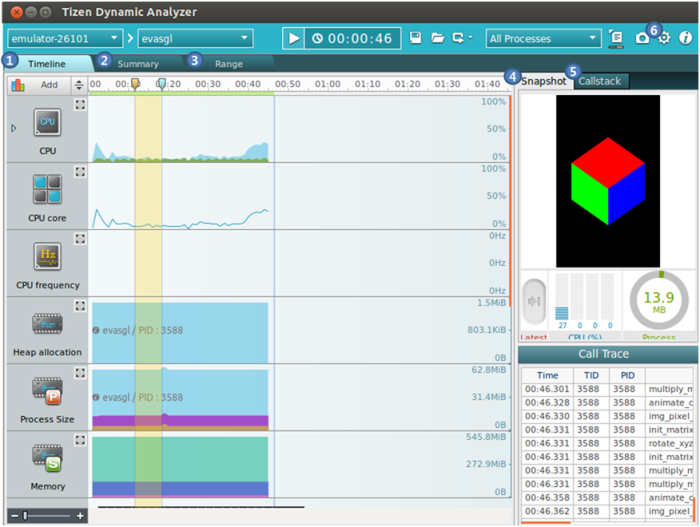
Dynamic Analyzer provides various functions for profiling applications. To better understand the profiling result, you need to know about each component that tool screen contains, providing you with the tracing information of your application.
Figure: Dynamic Analyzer screen
-
Timeline
The Timeline tab shows the application data values over time as a graph.
-
Summary
The Summary tab consists of views showing failed APIs, leaks, profiling information, and warnings.
-
Range
The Range tab provides application performance data of a selected range.
-
Snapshot
The Snapshot view shows the current screen capture and CPU usage, process usage, and available memory.
-
Callstack
The Callstack view shows the callstack of the selected function in the Call Trace.
-
Settings
The Settings button shows the setting dialog box that you can set the analysis features and other options.
The dynamic analyzer can also contain the following tabs and pages:
-
File
The File tab shows an analysis of file usage.
-
Thread
The Thread tab shows information about thread and synchronization.
-
Network
The Network tab displays information about the network.
-
OpenGL
The OpenGL page displays information about OpenGL® 2.0 and EvasGL.
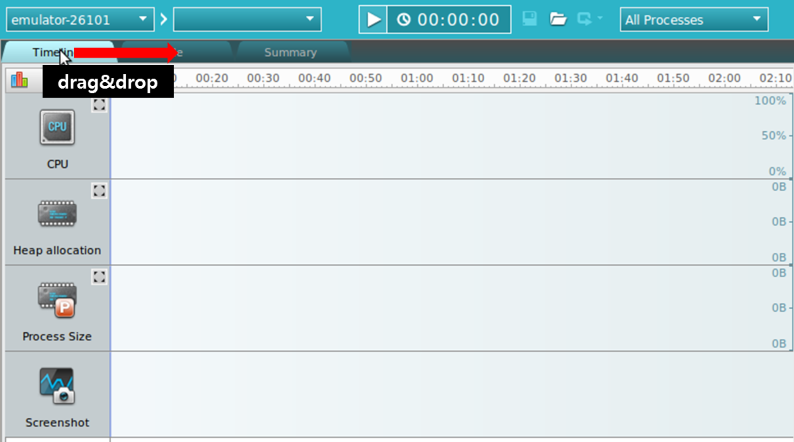
The tabs on the main display can be reordered by dragging and dropping.
Figure: Tab pages
The analysis result helps you to recognize and fix bottlenecks, bugs, and memory and resource leaks. For instructions on running the dynamic analyzer and ways to analyze the result and utilize the result for improving your application performance, see Dynamic Analysis.
Settings
The settings button on the toolbar opens the Settings dialog box, which is used to adjust the dynamic analyzer functions during operation or stop.
The Settings dialog box consists of the following tabs:
-
Features
The target shows a list of the currently supported profiles.
The template is a combination of several useful features and you can set up a template for each target. When you select a template, the template description is displayed on the screen.
Figure: Features tab
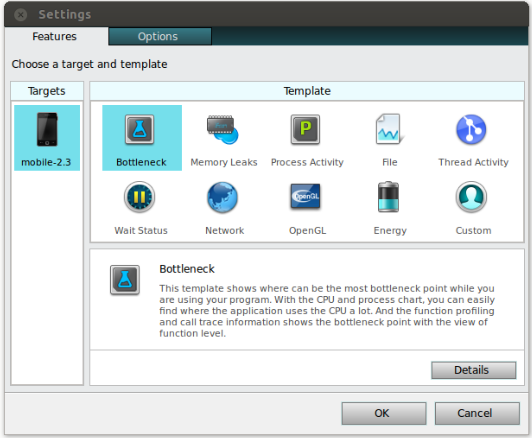
The following templates are provided:
- Bottleneck: This template shows where can be the most bottleneck point while you are using your program.
- Memory Leaks: This template shows the memory leak detected by this tool.
- Process Activity: This template shows the overall activities of your concerning processes (process CPU load and memory usage).
- File: This template shows the operations (open, close, read, write, and lock) of the files that were accessed by your application.
- Thread Activity: This template measures CPU usage of threads, visualizes life-cycle of each thread and relationship between threads.
- Wait Status: This template shows various information that cause the process become wait status.
- Network: This template shows the TCP/UDP network activity of the glibc socket.
- OpenGL: This template shows detailed information of the openGL layer.
- Energy: This template informs you of power consumption of target device.
- Custom: This template can be configured by selecting the desired features. If you change a feature in another template, the change effects the custom template.
When you click the Details button in the Features tab, the Feature details dialog appears on the screen.
Figure: Feature details
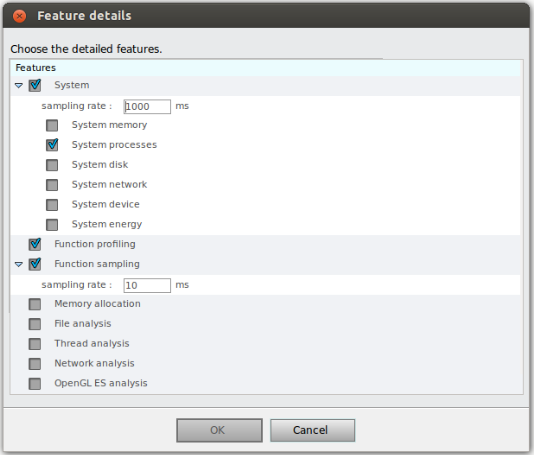
The Feature detail dialog contains the following settings for feature analysis:
- System: Displays the system information.
- Function profiling: Displays the function profile.
- Function sampling: Displays the function sampling.
- Memory allocation: Displays the heap memory allocation.
- File analysis: Displays the file usage analysis on the File tab and the file chart on the Timeline tab.
- Thread analysis: Displays information about the thread and synchronization.
- Network analysis: Displays information about the network.
- OpenGL® ES analysis: Displays information about the OpenGL® layer.
- UI Event: Displays UI events that occur on the device.
-
Options
The configuration settings define the dynamic analyzer configuration.
Figure: Options tab
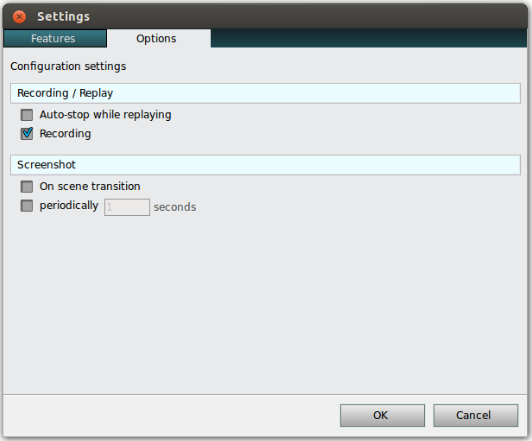
- Recording / Replay option
-
Auto-stop while replaying: Reproduces the information that was saved through the dynamic analyzer previously. The stored information has an end time.
Select this option to terminate at the same time as before.
- Recording: Repeats a previous analysis.
-
Auto-stop while replaying: Reproduces the information that was saved through the dynamic analyzer previously. The stored information has an end time.
- Screenshot option
- On scene transition: Shows screenshots of the application UI changes.
- Periodically: Shows screenshots according to a set period.
- Recording / Replay option
