

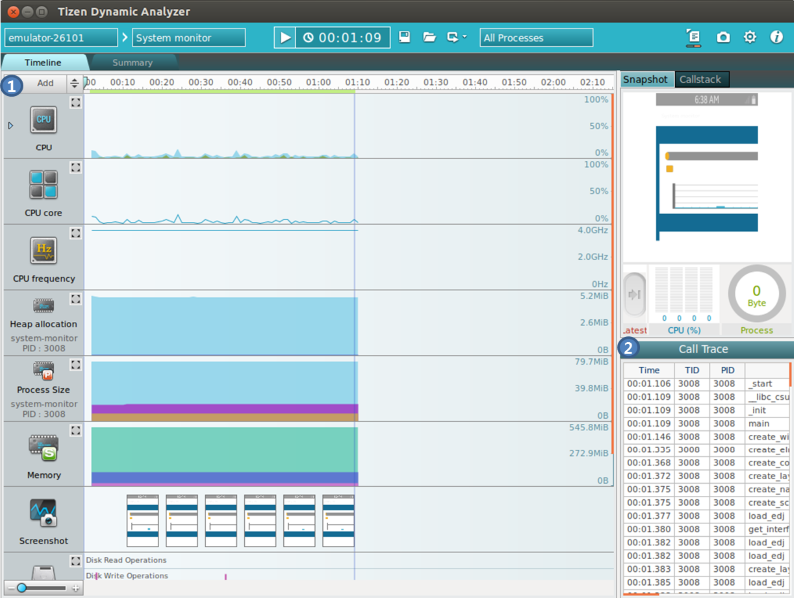
Timeline
The Timeline tab of the dynamic analyzer shows the data values over time as a graph.
The tab consists of the following views:
- Timeline chart shows the data values in a graph. The chart content can be edited in the Edit chart dialog.
- Call Trace shows the user API calls.
Figure: Timeline information
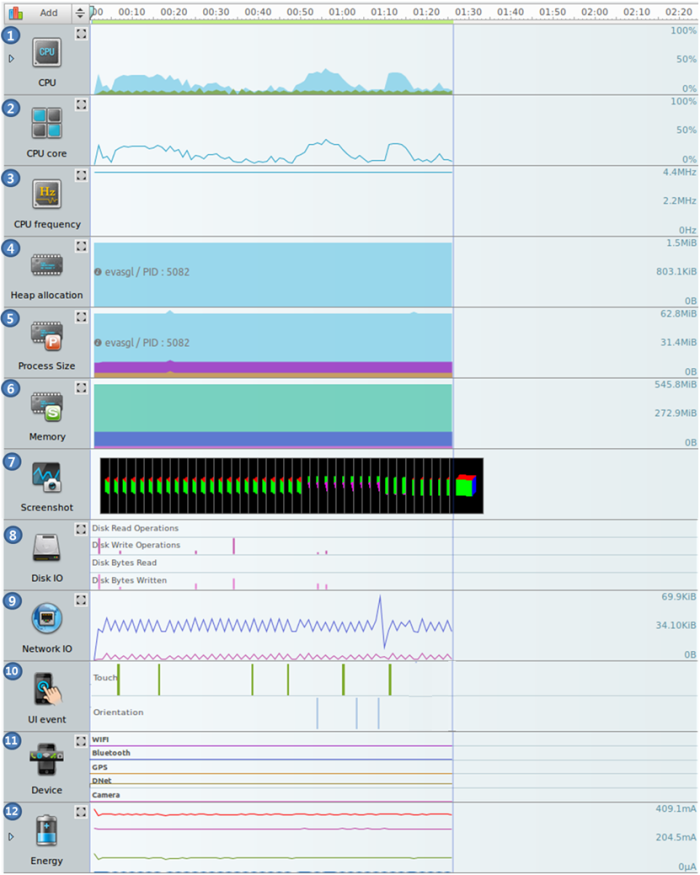
Timeline Chart
The timeline chart shows the data values over time as a chart. You can create 12 different charts, which can be selected from the left side of the window.
Figure: Timeline chart
-
CPU chart
Shows CPU usage.
 : System CPU usage (%)
 : Application CPU Usage (%)
-
CPU core chart
Shows CPU core usage. Depending on the number of device cores, the number of lines on the chart varies.
-
 : CPU core0 usage (%)
  : CPU core1 usage (%)
 : CPU core2 usage (%)
 : CPU core3 usage (%)
 : CPU core4 usage (%)
 : CPU core5 usage (%)
 : CPU core6 usage (%)
 : CPU core7 usage (%)
-
-
CPU frequency chart
Shows CPU frequency. Depending on the number of device cores, the number of lines on the chart varies. In the Emulator, the frequency is always 0.
 : CPU core0 frequency (KHz)
 : CPU core1 frequency (KHz)
 : CPU core2 frequency (KHz)
 : CPU core3 frequency (KHz)
 : CPU core4 frequency (KHz)
 : CPU core5 frequency (KHz)
 : CPU core6 frequency (KHz)
 : CPU core7 frequency (KHz)
-
Heap allocation chart
Shows heap memory allocation. System total and app-allocated data is shown. Confirm additional binary allocation if you have set the binary in the setting dialog.
If a process is added, a child chart is dynamically created for the added process.
-
 : System total allocated (KB)
 -
 : App-allocated (KB)
 - Optionally, binary (user set) allocated (KB)
-
-
Process Size chart
Shows amount of memory usage. VSS is virtual memory, RSS is physical memory and PSS is process's private memory + shared memory / number of shared processes.
If a process is added, a child chart is dynamically created for the added process.
 : Total VSS (virtual set size) memory (KB) size of the process
 : Physical RSS (resident set size) memory (KB) size used by the process
 : PSS (proportional set size) memory (KB) in the following format: [(Unique memory + Shared memory)/number of processes sharing the memory].
-
Memory chart
Shows system memory usage.
 : System maximum memory (KB)
 : System used memory (KB)
 : App used memory (KB)
-
Screenshot chart
Shows screenshots (they can be taken only when the Take snapshot button is enabled).
Note The screenshot is captured about 2 seconds after the scene or form is transformed. To capture screenshots perfectly, use scene management or animation to transform a panel or form. -
Disk IO chart
Shows the disk's read and write bytes and the number of sectors.
 : Disk read operation counts
 : Disk write operation counts
 : Disk bytes read size (KB)
 : Disk bytes written size (KB)
-
Network IO
Shows the network send and receive bytes.
 : Receive bytes (KB)
 : Send bytes (KB)
-
UI Event chart
Shows UI events that occur on the device.
 : Touch event
 : Orientation event
-
Device chart
Shows the status of Wi-Fi, Bluetooth, GPS, DNet, and camera on the device.
 : Wi-Fi
 : Bluetooth
 : GPS
: GPS : DNet
 : Camera
-
Energy chart
Shows the power consumption of Flash memory, CPU, and LCD.
 : Total energy usage (mA)
 : Flash memory (mA)
 : CPU (mA)
 : LCD (mA)
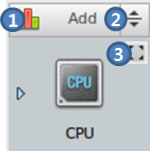
Chart Buttons and Slider
You can use the chart buttons to ease the analysis.
Figure: Chart buttons
-
Add button
The button activates the Edit chart dialog. You can define which charts are visible in the Timeline page.
-
Chart Minimize button
Comparing different charts can be helpful. You can do it easily by minimizing all the charts.
-
Chart Maximize button
To see the chart in more detail, maximize it.
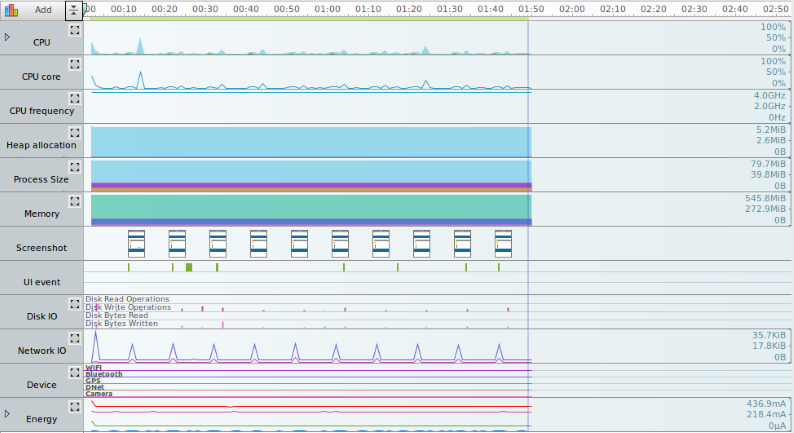
Managing Life-cycle and Scale
To manage the process life-cycle and modify the time scale:
- Confirm the status of the target process through the life-cycle bar.

 : Initializing status
 : Running status
 : Pausing status
 : Terminating status
- Adjust the chart's time scale using the scale slider at the bottom left.
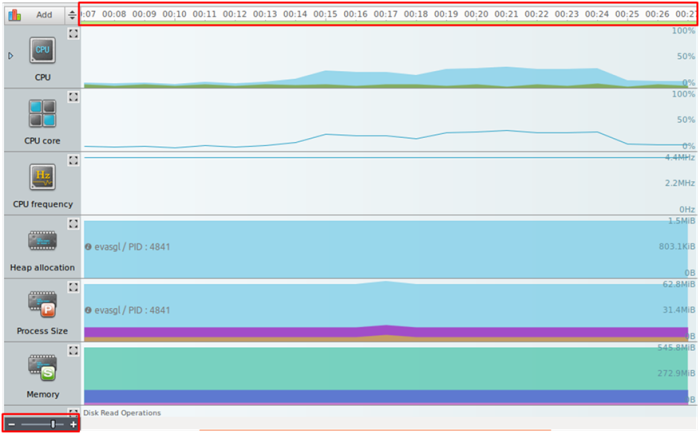
Chart Configuration
The Edit chart dialog (activated with the Add button at the top-left corner of the dynamic analyzer) is an editor window for managing the Timeline page chart. The Edit chart dialog can be used to control the order in which the visible charts are shown on the Timeline page in runtime. To change the order, drag the applicable chart to the new location. To change the visibility state of a chart, click the chart. For a detailed description of each chart, see Timeline Chart.
Figure: Chart Configuration
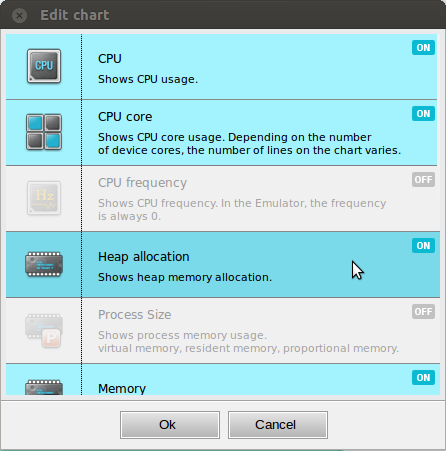
The chart classifies the visibility states by color:
- Blue
Chart is visible on the Timeline tab.
- Grey
Chart is not visible on the Timeline tab.
Call Trace
The Call Trace shows the user method callstack that occurs during an application execution.
The Time column shows the calling time of the API, Thread id column shows the thread ID, and API column shows the API name.
When you select a list item:
- The call time is shown in the Timeline view. If you select multiple calls, the call time range is shown.
- If you select a single call, the status and image is shown in the Snapshot view.
- The API callstack is shown in the Callstack view.
The Call Trace view can occasionally show methods that you have not defined in the application. If an application class inherits a super class and does not declare the constructor of the super class, the compiler automatically generates the default constructor code in the application binary.
| Note |
|---|
| If your application is built by setting the optimization option above O0 (default value), the API callstack-related information shown in the Call Trace view can be incorrect. To profile your application with the dynamic analyzer, you must not change the optimization option. |
