Network Analysis
The Network tab of the dynamic analyzer displays network information. It only supports the socket APIs of glibc.
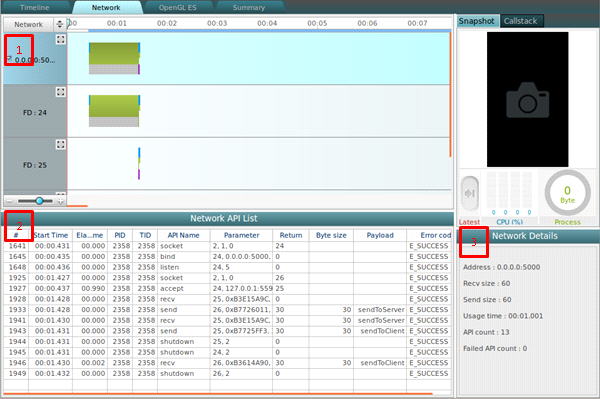
The tab consists of the following views:
- Network chart shows socket operations (open/close, using, failed) as a time flow chart.
- Network API List view shows the socket APIs that are associated with the socket selected in the socket chart.
- Network Details view shows detail information of the socket selected in the socket chart.
Figure: Network analysis

Network Chart
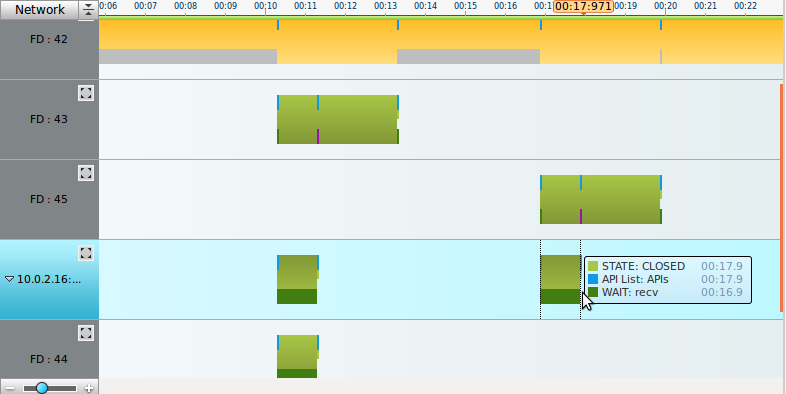
The Network chart displays the socket object in a tree format using a graph.
Figure: Network chart

The color of horizontal bar in the chart indicates the state of the socket:
- Yellow area indicates the socket state is open.
- Green area indicates the socket is closed.
The line in the bar indicates the status of the API of the socket.
- The upper line:
- Blue line indicates that the API has been used.
- Red line indicates that the API has failed.
- The lower line:
- Purple area or line indicates the read area of the socket.
- Lime green area or line indicates the write area of the socket.
Network API List
The Network API List view displays the APIs associated with the socket object selected in the network chart.
Figure: Network API List view

The view has the following columns:
- # (integer) shows the unique log index.
- Start Time (time) defines the time when the API was called.
- Elapsed Time (time) defines the time to return after the call.
- PID (integer) is the API process ID.
- TID (integer) is the API thread ID.
- API Name (text) is the API name.
- Parameter shows the input parameter of the API.
- Return value (integer) defines the return value.
- Byte size (integer) shows a byte size received from the destination address.
- Payload (text) shows the content of the data transfer.
- Error code (text) shows the error description of the API. Normal end return is the E_SUCCESS.
Network Details
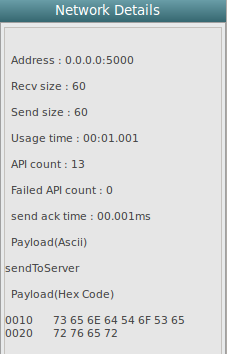
The Network Details view displays detailed information of the network socket object selected in the network chart.
Figure: Network Details view

The view has the following fields:
- Address displays the destination address.
- Recv size is the byte size received from the destination address.
- Send size is the byte size sent to the destination address.
- Usage time is the time using the socket object API.
- Failed API count is the number of the failed APIs.
- Send ack time is the received time after sending to the destination address.
- Payload (Ascii) is the content of the data transfer by Ascii.
- Payload (Hex Code) is the content of the data transfer by Hex code.


