

Other Views
The dynamic analyzer provides the Callstack and Snapshot views.
Callstack
The Callstack view shows the callstack of the selected API or item.
The view has the following columns:
- Function shows the symbol name.
- Address shows the symbol address.
- Binary path shows the symbol path.
If the symbol is located in the user binary, it is shown in blue. If the symbol name cannot be found, it is marked as an unknown function.
Snapshot
The Snapshot view shows the current screen capture and CPU usage, process usage, and available memory.
Figure: Snapshot view
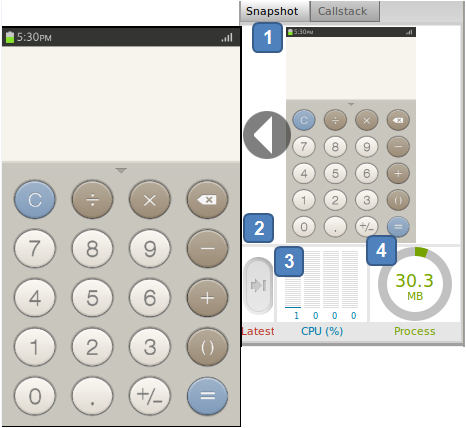
The Snapshot view contains the following components:
- Image viewer
The image viewer shows a snapshot of the current screen.
If you select an image, the Call Trace view and the timeline chart content moves to the API at that time.
- Latest
The latest button is used to show the current state of the snapshot view content.
- CPU usage
The bar chart shows the CPU use percentage of the selected point. The chart shows the usage of up to 4 CPUs.
- Process size
The circular chart shows the process memory size of the selected point.
