

Optimizing Application Performance
The application performance optimization features include measuring and improving application performance.
If an application performs poorly and gives delayed responses to user actions, the user experience can suffer. To avoid this situation, some parts of the code must be optimized.
Most processors that are used today in mobile phones are based on multi-core technologies and so you must consider utilizing this hardware feature. To effectively utilize multi-core capabilities, you need to divide your code to run on several cores simultaneously. Traditionally, this is done by using pthreads, but this method has an overhead of initialization and termination of threads, and can generate potential runtime errors. Several solutions exist to exploit multi-core capabilities easily. These solutions abstract pthreads, allowing you to focus on the native application development without worrying about thread level management.
To improve the performance of an application:
- Identify the bottlenecks which need to be optimized.
- Optimize the bottlenecks by code refactoring.
- Measure performance to compare refactoring gains.
- If the performance goal is met, you can stop the process, else go to step 2 and repeat till the goal is met.
Measuring Application Performance
Tizen SDK supports various tools which help to measure performance and increase performance at runtime:
-
Dynamic Analyzer
Dynamic Analyzer helps to identify bottlenecks and improve resource usage patterns in native applications. For more information on its usage, see Dynamic Analysis.
-
Valgrind
Valgrind detects memory errors or leaks. This tool helps to improve memory usage patterns in native applications. For more information on its usage, see Valgrind Analysis.
Measuring performance allows you to identify bottlenecks that take a critical amount of time during the program execution and to compare the code execution time before and after optimization.
Profiling can show unexpected bottleneck locations that you have not noticed otherwise. Once bottlenecks are identified, you can consider applying threading mechanism to clear them. This solution does not work in all situations or for all algorithms, but it can be worth spending your time to investigate the possibilities. Code refactoring is required to apply the threading mechanism.
Performance Tips
A faster application can increase battery life. If your application is not as fast as expected, you can look at profiling data to identify bottlenecks. Fixing these bottlenecks increases the application speed with minimal effort.
Some general tips to improve the performance of your application are:
- Select the right algorithm and data structures.
- High-level optimization is important because it can change the order of complexity. If your code includes sort, search, or compare, use optimal algorithms and data structures.
- Split a task which contains both high and low priority jobs to prevent low priority jobs delaying high priority jobs. Running high and low priority jobs in a single task causes delays.
- Do not run heavy calculations in the same thread as your GUI.
- Use optimization options provided by toolchains.
Dynamic Analysis
To make your applications powerful, faster, and more stable, you need to analyze their performance to recognize and fix bottlenecks, bugs, and memory and resource leaks.
The following instructions and examples help you to use the dynamic analyzer effectively:
-
Running Dynamic Analyzer
Describes how to launch the dynamic analyzer.
-
Using the Analysis Result
Describes how to utilize the dynamic analyzer for various improvement purposes.
Running Dynamic Analyzer
You can launch the dynamic analyzer in the IDE or as a standalone application from the Tizen SDK submenu.
To launch the dynamic analyzer in the IDE:
- Right-click your project in the Tizen IDE Project Explorer view.
- Select Profile As > Profile with Dynamic Analyzer.
The selected project is built, packaged, and installed on the target device. The dynamic analyzer is launched and the profiling starts automatically.
To run the dynamic analyzer as a standalone from the Tizen SDK menu:
- Launch the dynamic analyzer from the SDK submenu.
- Select the target device and the application to be traced from the combo box in the dynamic analyzer toolbar.
- Click the Trace Start button.
The performance details of your application retrieved during tracing are stored in trace files. You can manage the trace files through the Toolbar.
The following figure illustrates the components of the Toolbar used for running the dynamic analyzer.
Figure: Toolbar

-
Target
The Target combo box shows a serial number (if the target is a device), or the Emulator name (if the target is the Emulator).
-
Application
The Application combo box contains a list of applications in the selected target.
If the Target combo box is empty or disabled, the Application combo box is disabled.
-
Start/Stop
The Start/Stop button starts or stops the tracing of the selected application. While tracing, the trace result and UI sequence is automatically recorded and temporarily saved. To store the record permanently, click Save Trace.
-
Timer
The timer starts when you click the Start button and updates every second. It shows the current running time of the dynamic analyzer. If you click Stop, the timer stops when the analysis processing is complete.
-
Save Trace
Clicking the Save Trace button saves the trace data permanently.
-
Open Trace
Clicking the Open Trace button loads and displays the saved trace data.
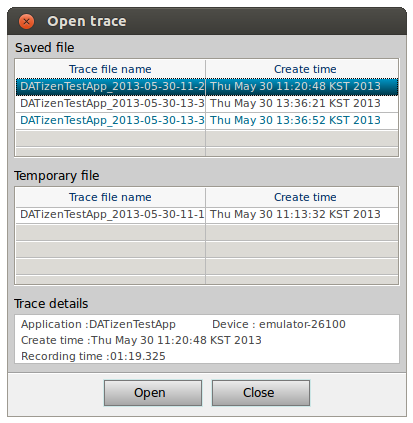
The Open Trace window consists of the following panels:
-
Saved file
Shows the trace saved by clicking the Save Trace button.
An invalid save version trace is shown in orange color and cannot be opened. A valid trace is shown in black color. The currently opened trace is shown in blue color.
-
Temporary file
Shows the temporary traces. A temporary trace refers to a trace that has not been saved and is deleted when the program exits.
-
Trace details
Shows trace information of the saved traces from the Saved file and Temporary file panels.
To open a trace, double-click the trace or select the trace and click Open.
To delete a trace, select the trace and click the delete key on your keyboard.
-
Saved file
-
Replay
Clicking Replay repeats a previous analysis. You can use data from a previous dynamic analyzer instance or a saved trace data file. If the target or application do not match, the button is disabled.
-
Process
The Process combo box has a process list of the application being traced. By default, the dynamic analyzer shows the analysis results of all processes. If you select a process in the list, the dynamic analyzer shows the analysis result of that process only.
-
View Source
The View Source button displays the source code. If you click the button and the mouse is on the method name in any table-like view, the source code is displayed as a tooltip. By double-clicking the tooltip you can see the source code in the IDE. Apart from the Callstack view, the source code displayed is the caller part of the selected API, not the API definition.
If an API is called from a shared library, the source code is not displayed as the source code of the shared library is not available.
In the Callstack view, the source code corresponding to the address of the selected callstack unit is displayed.
Note If the source code exists outside Tizen IDE, for example, in a built-in application on a device, the View Source button is disabled. The source view is available only for applications which are built as normal native projects in the IDE on the local machine.
-
Capture screen
The Capture screen button captures the screen of the target at the time. The screenshot is shown in the Snapshot view.
-
Settings
The Settings button opens the Settings window. It supports the runtime configuration feature and other settings.
-
About
The About button opens the About window, which displays the dynamic analyzer version, build time, and license.
Using the Analysis Result
After the profiling is terminated by the dynamic analyzer, analyze the result. The dynamic analyzer provides a variety of information collected while your application was run. Use the result selectively to meet your improvement purposes.
The following instructions help you to utilize the analysis result:
-
Performance Analysis
Describes how to analyze application performance.
-
Detecting Leaks
Describes how to detect memory and resource leaks.
-
Multi-threaded Application and Synchronization Analysis
Describes how to analyze threads and synchronization.
Performance Analysis
You can use the dynamic analyzer to analyze application performance and identify bottlenecks. After identifying bottlenecks, you can modify the code to eliminate them, which increases application performance significantly, and extends the battery life of the device running the application.
To analyze performance of the application with the dynamic analyzer, use the following features:
- User Function Profiling
When analyzing application performance, execution time of each method is one of the most significant factors. You can improve the performance of an application by identifying unexpected bottleneck locations, and analyzing and optimizing the most used methods in the dynamic analyzer.
To detect and fix the methods consuming the most time:
- Select the Summary tab and view the Function Usage Profiling view displaying the methods consuming the most time. Click the title of a column to view the sorted results.
- To view the execution time of the methods called within a specific time period, use the range information feature of the dynamic analyzer.
The time consumed by UI-related methods is displayed on the UI Function Profiling view of the UI tab.
- Timeline CPU Chart
When analyzing application performance, the CPU load is one of the most significant factors. A CPU load peak can result in a performance bottleneck. High CPU load leads to increased memory consumption, which shortens the battery life of the device running the application. To avoid this, you need to optimize your code.
Figure: Timeline CPU chart
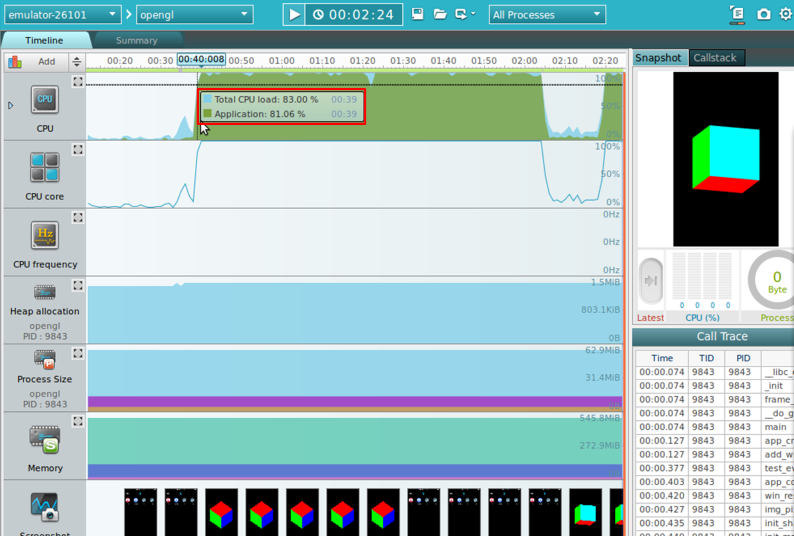
To detect and fix CPU load peaks with the CPU load feature of the dynamic analyzer:
- Select the Timeline tab and view the CPU chart.
- Hover the mouse on a CPU peak to view the CPU load value in a tooltip.
- Click the CPU peak to highlight the last user method called before the peak in the Call Trace view.
- Click the View Source button and place the mouse on the highlighted method. The source code is displayed as a tooltip. To investigate the method, double-click on it, and the source code is displayed in the IDE.
- Modify the code in the IDE, re-build, and re-analyze the application to see if the bottleneck has been eliminated.
- Thread Load
If you use threads in your application code, you need to analyze the load of each thread during the application execution. The thread load feature helps to distribute the thread load. You can modify the code to optimize the thread load, while maintaining a single thread.
The thread load is displayed in the Thread tab.
Figure: Thread load
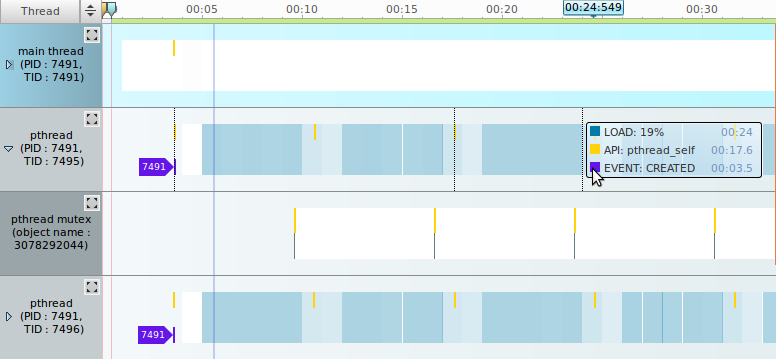
The thread line displayed in blue indicates the thread load within a time frame. The darker the color, the higher the load.
When modifying the application code to improve its performance, consider the following:
- Select the right algorithm and data structures.
- High-level optimization is important because it can change the order of complexity. If your code includes sort, search, or compare, use optimal algorithms and data structures.
- Running high and low priority jobs in a single task causes delays. Split the jobs into multiple tasks.
- Do not run heavy calculations in the same thread with your GUI.
- Use optimization options provided by toolchains.
Detecting Leaks
To improve the performance of your application, you can use the dynamic analyzer to detect memory leaks.
Memory leaks occur when memory capacity that is dynamically allocated during application execution is not returned after the execution stops. Severe or accumulating memory leaks can affect the performance of other applications and programs.
To detect and fix memory leaks using the dynamic analyzer:
- To view the memory leaks occurring during application analysis, select the Summary tab.
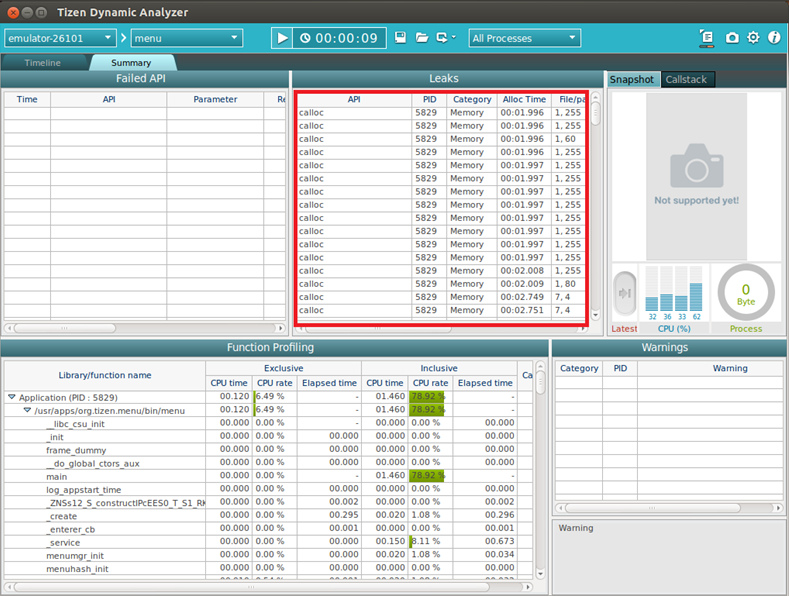
All the listed items are not memory leaks. To identify actual memory leaks, look for applications that are already terminated but have not returned the allocated memory. When these leaks are fixed, they disappear from the list.
- Click the View Source icon in the toolbar.

- Move the mouse pointer to the list item you want to check. The source code is displayed as a tooltip. The part causing the memory leak is displayed in red.
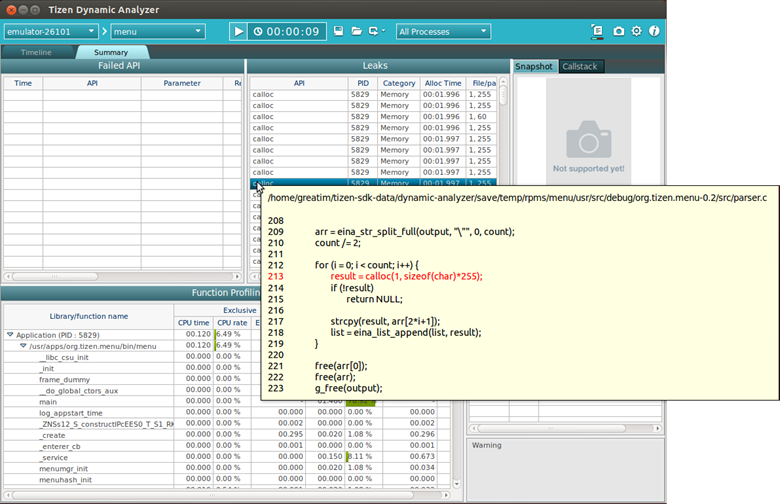
- To view the entire source code in the IDE and fix the leak, double-click the list item. If the IDE is not running the dynamic analyzer launches it automatically.
Multi-threaded Application and Synchronization Analysis
Understanding the thread execution in multi-threaded applications can be challenging. The GDB (GNU Debugger) supports the process of debugging multi-threaded applications, but since it uses synchronization objects, the debugging can be quite difficult. The dynamic analyzer, on the other hand, provides effective thread analysis features.
You can use the dynamic analyzer to:
Analyzing Thread Life-cycle
Testing threads is difficult as they are nondeterministic. Visualizing the thread life-cycle is an effective method for analyzing the thread life-cycle.
The dynamic analyzer has 3 types of user threads:
- Main thread created from the system for running applications
- Tizen threads including worker threads and event-driven threads
- pthread
In the thread chart, the thread life-cycle is displayed as follows:
-
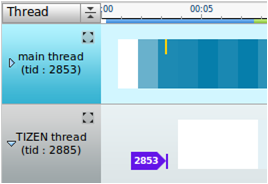
Thread creation: When an API is called to create the thread, a yellow bar is displayed and a new chart item is created with a tid arrow.
Figure: Creating a thread
-
Thread exiting: When a thread exits, a purple bar is displayed with a joined tid arrow. If another thread calls the API of the exited thread, a yellow bar is displayed.
Figure: Exiting a thread
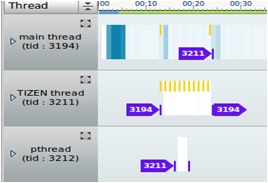
A new thread is created in a joinable state. Otherwise, memory and resource leaks can occur until the process ends. To make the process faster, set the thread to the detach state, or call the detach API. You can check the state of the thread on the Thread tab.
Analyzing Thread Concurrency
The number of live threads and their resource usage can be used to determine an efficient thread concurrency.
The thread chart displays the relationship and progress between threads and allows you to check the number of live threads. The CPU load of a thread is also displayed.
Analyzing Synchronization
When multiple threads access the same resources, data race occurs. To avoid this, threads must be synchronized.
The synchronization chart in the dynamic analyzer has the following synchronization objects:
- Tizen mutex
- Tizen monitor
- Tizen semaphore
- pthread mutex
- pthread condition variable
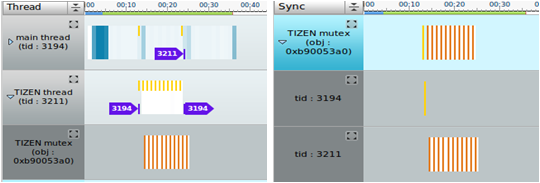
You can view the synchronization chart based on the thread, or the synchronization status:
- To view the child of each thread chart item, select Thread in the synchronization chart combo box.
- To view the parent item with the thread for each usage showing the child items, select Sync.
Figure: Synchronization chart types
A synchronization object can be checked using the synchronization chart. When a synchronization object acquires a lock, the thread enters the critical section. The dynamic analyzer analyzes the critical section duration and waiting time.
If the critical section duration increases, the thread stops working concurrently and affects the performance. If a thread acquires a lock, the critical section waiting time of the other threads increases. To avoid potential dead lock, reduce the waiting time.
Figure: Dead lock warning

Valgrind Analysis
Valgrind helps you to detect memory errors or leaks in your application at runtime.
The following instructions and examples help you to use the Valgrind effectively:
-
Running Valgrind
Describes how to launch the Valgrind with your application.
-
Viewing Valgrind Result
Describes the information of the result analyzed by Valgrind.
Running Valgrind
To set the Valgrind options for your application:
- In the Project Explorer view, right-click the project and select Profile As > Profile Configurations.
- In the Profile Configurations window, right-click the Profile with Valgrind and select New.
- Select the created configuration.
- Go to Memory Profile Options > Collect data tab:
Select from 2 types of memory profiling settings:
- Memory error and memory leak checking
This option uses the Memcheck tool to profile your application.
- Heap memory profiling
This option uses the Massif tool to profile your application.
- Memory error and memory leak checking
-
On the General setting tab, set the general Valgrind options. These options are used for both Memcheck and Massif profiling.
Figure: Memory error and memory leak data options
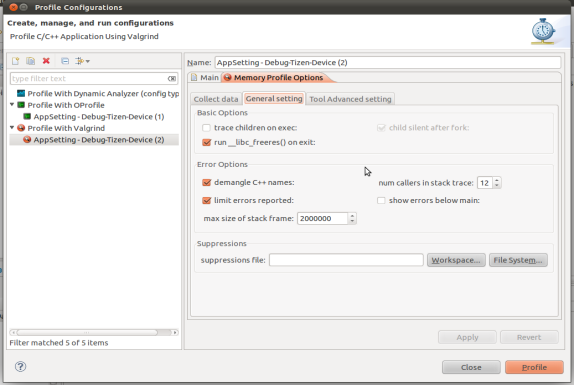
Table: General setting options Option name Description trace children on exec When enabled, Valgrind traces into sub-processes initiated through the exec system call. This is necessary for multi-project applications. Valgrind does trace into the child of a fork (it would be difficult not to, since fork makes an identical copy of a process), so this option is arguably badly named. However, most children of fork calls immediately call exec anyway.
run __libc_freeres() on exit This option is only relevant when running Valgrind on Linux.
The GNU C library (libc.so), which is used by all applications, can allocate memory for its own uses. Usually it does not free that memory when the application ends, since the Linux kernel reclaims all process resources when a process exits anyway. The glibc authors realized that this behavior causes leak checkers, such as Valgrind, to falsely report leaks in glibc, when a leak check is done at exit. In order to avoid this, they provided a routine called __libc_freeres() specifically to make glibc release all memory it has allocated. Memcheck therefore tries to run __libc_freeres() at exit. Unfortunately, in some very old versions of glibc, __libc_freeres() is sufficiently buggy to cause segmentation faults. This was particularly noticeable on Red Hat 7.1. So this option is provided in order to inhibit the run of __libc_freeres(). If your application seems to run fine on Valgrind, but segfaults at exit, disabling this option can fix the problem, although at the cost of possibly falsely reporting space leaks in libc.so.
demangle C++ names Automatic demangling (decoding) of C++ names is enabled by default. When enabled, Valgrind attempts to translate encoded C++ names back to something approaching the original. The demangler handles symbols mangled by g++ versions 2.X, 3.X, and 4.X.
An important fact about demangling is that method names mentioned in suppressions files must be in their mangled form. Valgrind does not demangle method names when searching for applicable suppressions, because to do otherwise would make suppression file contents dependent on the state of Valgrind's demangling machinery, and also slow down suppression matching.
num callers in stack trace This option specifies the maximum number of entries shown in stack traces that identify application locations. Errors are commoned up using only the top four method locations (the place in the current method, and that of its 3 immediate callers). So this does not affect the total number of errors reported. The maximum value for this option is 50. Note that higher settings make Valgrind run more slowly and take more memory, but can be useful when working with applications with deeply-nested call chains.
limit errors reported When enabled, Valgrind stops reporting errors after 10,000,000 in total, or 1,000 different ones, have been seen. This is to stop the error tracking machinery from becoming a huge performance overhead in applications with many errors.
show errors below main By default, stack traces for errors do not show any methods that appear beneath main(). Alternatively, if main() is not present in the stack trace, it does not show any methods below main()-like methods, such as glibc's __libc_start_main(). Furthermore, if main()-like methods are present in the trace, they are normalized as (below main()), in order to make the output more deterministic. If this option is enabled, all stack trace entries are shown and main()-like methods are not normalized.
max size of stack frame This option specifies the maximum size of a stack frame. If the stack pointer moves by more than this amount, Valgrind assumes that the application is switching to a different stack.
You can to use this option if your application has large stack-allocated arrays. Valgrind keeps track of your application's stack pointer. If it changes by more than the threshold amount, Valgrind assumes your application is switching to a different stack, and Memcheck behaves differently than it would for a stack pointer change smaller than the threshold. Usually this heuristic works well. However, if your application allocates large structures on the stack, this heuristic is fooled, and Memcheck subsequently reports large numbers of invalid stack accesses. This option allows you to change the threshold to a different value.
You must only consider the use of this option if Valgrind's debug output directs you to do so. In that case, it tells you the new threshold you must specify.
In general, allocating large structures on the stack is a bad idea, because you can easily run out of stack space, especially on systems with limited memory or which expect to support large numbers of threads each with a small stack, and also because the error checking performed by Memcheck is more effective for heap-allocated data than for stack-allocated data. If you have to use this option, consider rewriting your code to allocate on the heap rather than on the stack.
suppressions file This option specifies an extra file from which to read descriptions of errors to suppress. You can use up to 100 extra suppression files.
-
On the Tool Advanced setting tab, set the advanced options.
The tab content depends on the selection you have made on the Collect data tab.
Table: Tool Advanced setting options for memory error and memory leak profiling Option name Description leak check This option, when enabled, searches for memory leaks when the client application finishes. If set to summary, it lists out how many leaks occurred. If set to full or yes, it also gives details of each individual leak.
leak resolution When performing leak checks, this option determines how willing Memcheck is to consider different backtraces to be the same for the purposes of merging multiple leaks into a single leak report. When set to low, only the first 2 entries need match. When set to med, 4 entries have to match. When high, all entries need to match.
For hardcore leak debugging, you probably want to use --leak-resolution=high together with --num-callers=40 or a similar large number. The --leak-resolution setting does not affect Memcheck's ability to find leaks. It only changes how the results are presented.
freelist size (blocks) When the client application releases memory using free (in C) or delete (C++), that memory is not immediately made available for re-allocation. Instead, it is marked inaccessible and placed in a queue of freed blocks. The purpose is to defer as long as possible the point at which freed-up memory comes back into circulation. This increases the chance that Memcheck is able to detect invalid accesses to blocks for some significant period of time after they have been freed.
This option specifies the maximum total size, in bytes, of the blocks in the queue. The default value is 20 million bytes. Increasing this increases the total amount of memory used by Memcheck, but can result in the detection of invalid uses of freed blocks which would otherwise go undetected.
show reachable blocks When disabled, the memory leak detector only shows "definitely lost" and "possibly lost" blocks. When enabled, the leak detector also shows "reachable" and "indirectly lost" blocks. It shows all blocks, except suppressed ones, so --show-all would be a better name for it.
allow partial loads This option controls how Memcheck handles word-sized, word-aligned loads from addresses for which some bytes are addressable and others are not. When set to yes, such loads do not produce an address error. Instead, loaded bytes originating from illegal addresses are marked as uninitialized, and those corresponding to legal addresses are handled in the normal way.
When set to no, loads from partially invalid addresses are treated the same as loads from completely invalid addresses, an illegal-address error is issued, and the resulting bytes are marked as initialized.
The code that behaves in this way is in violation of the ISO C/C++ standards, and must be considered broken. If at all possible, such code must be fixed. This option must be used only as a last resort.
undef value errors This option controls whether Memcheck reports uses of undefined value errors. If you do not want to see undefined value errors, set this to no. It also has the side effect of slightly speeding up Memcheck. Table: Tool Advanced setting options for heap memory profiling Option name Description profile heap This option specifies whether heap profiling is done.
administrative bytes per block If heap profiling is enabled, this option gives the number of administrative bytes per block to use. This must be an estimate of the average, since it can vary. For example, the allocator used by glibc on Linux requires somewhere between 4 to 15 bytes per block, depending on various factors. That allocator also requires admin space for freed blocks, but Massif cannot account for this.
profile stack This option specifies whether stack profiling must be done. This option slows Massif down greatly, and so is off by default. Massif assumes that the main stack has size zero at start-up. This is not true, but doing otherwise accurately is difficult. Furthermore, starting at zero better indicates the size of the part of the main stack that a user application actually has control over.
allocation tree depth The maximum depth of the allocation trees recorded for detailed snapshots. Increasing it makes Massif run somewhat more slowly, use more memory, and produce bigger output files.
heap allocation threshold The significance threshold for heap allocations is a percentage of the total memory size. The allocation tree entries that account for less than this are aggregated. This must be specified in tandem with ms_print's option of the same name.
allocation peak inaccuracy Massif does not necessarily record the actual global memory allocation peak. By default, it records a peak only when the global memory allocation size exceeds the previous peak by at least 1.0%. This is because there can be many local allocation peaks along the way, and doing a detailed snapshot for every one is expensive and wasteful, as all but one of them are later discarded. This inaccuracy can be changed (even to 0.0%) through this option, but Massif runs drastically slower as the number approaches zero.
time unit This option specifies the time unit used for the profiling. There are 3 possibilities:
- Instructions executed (i)
Good for most cases
- Real (wall clock) time (in milliseconds)
It is useful sometimes
- Bytes allocated/deallocated on the heap and/or stack (B)
It is useful for very short-run programs, and for testing purposes, because it is the most reproducible across different machines.
detailed snapshot frequency This option specifies the frequency of detailed snapshots. With --detailed-freq=1, every snapshot is detailed.
max snapshots This option specifies the maximum number of snapshots recorded. If set to N, for all programs except very short-running ones, the final number of snapshots is between N/2 and N.
minimum heap block alignment By default, Valgrind's malloc, realloc, and so on return a block whose starting address is 8-byte-aligned or 16-byte-aligned. The value depends on the platform and matches the platform default. This option allows you to specify a different alignment. The supplied value must be greater than or equal to the default, less than or equal to 4096, and must be a power of 2.
allocation functions Methods specified with this option are treated as though they were a heap allocation method, such as malloc. This is useful for methods that are wrappers to malloc or new, which can fill up the allocation trees with uninteresting information. This option can be specified multiple times on the command line, to name multiple methods.
The named method is only treated this way if it is the top entry in a stack trace, or just below another method treated this way. For example, if you have a method malloc1 that wraps malloc, and malloc2 that wraps malloc1, just specifying --alloc-fn=malloc2 has no effect. You need to specify --alloc-fn=malloc1 as well. This is a little inconvenient, but the reason is that checking for allocation method is slow, and it saves a lot of time if Massif can stop looking through the stack trace entries as soon as it finds one that does not match rather than having to continue through all the entries.
- Instructions executed (i)
- To save the settings, click Apply.
- To run Valgrind, click Profile.
Viewing Valgrind Result
After the memory profiling is terminated, you can view the profiling results.
Memory Error and Leak Results
The memory error table displays memory leaks that occurred during the profiling process.
- Memory error or Memory leak is the error or leak type.
- Function name is the location where the error occurred.
- Sizes is the memory size of the error.
- Address is the code memory address.
- Location is the source or executable path, or library path, where the error occurred.
- pid is the process ID, and tid is the thread ID.
If you expand an error entry, you can see the callstack of the method.
Heap Memory Profiling Results
The heap memory profiling table displays the heap memory consumed and allocated during the profiling process.
Figure: Heap memory profiling results
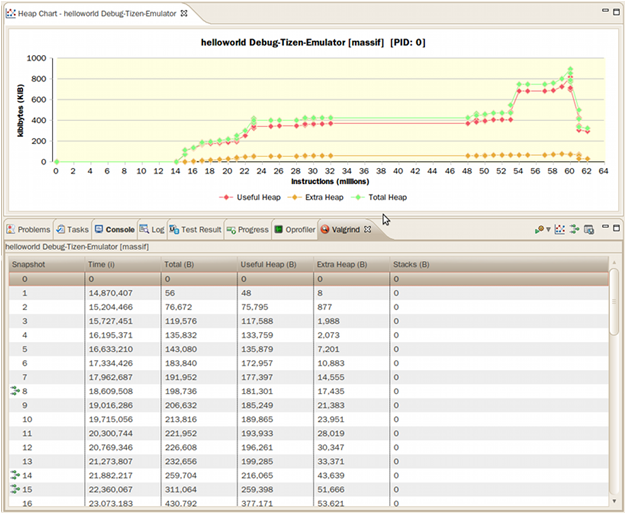
- Snapshot is the index number of the snapshot.
- Time (i) is the number of instructions being executed.
- Total (B) is the total heap memory consumption byte size.
- Useful Heap (B) is the size of the heap memory used by the program.
-
Extra Heap (B) is the size of the heap memory allocated in excess of what the program is using. The source of extra heap memory is:
- Administrative bytes of the heap memory block
- Aligned bytes of the requested memory size
- Stack (B) is the size of the stacks. By default, stack profiling is disabled as it slows profiling. It is enabled using the profile stack option.
A snapshot with a green icon in front has a heap tree with a callstack. Double-click the entry to see the callstack details.
For information on executing Valgrind on the command line interface, see the Valgrind User Manual.
Managing Results
To save a Valgrind profiling result, click Save file on the Valgrind result view toolbar.
To load a saved Valgrind result file, select File > Open File in the IDE menu.
