
Range
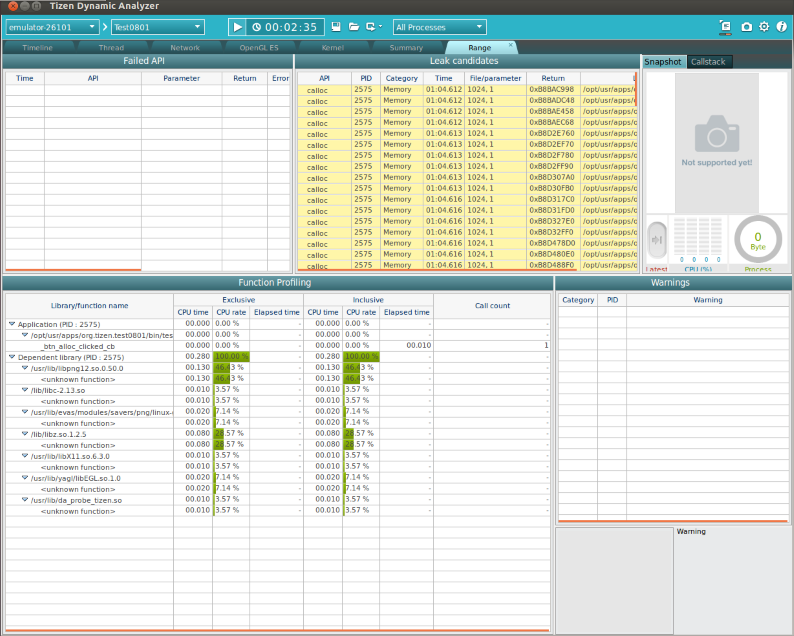
The range information feature of the dynamic analyzer provides information about the application performance in a selected range.
Figure: Range information

The range information can be created in one of the following 2 ways:
- Chart (Timeline, File, and Thread tabs)
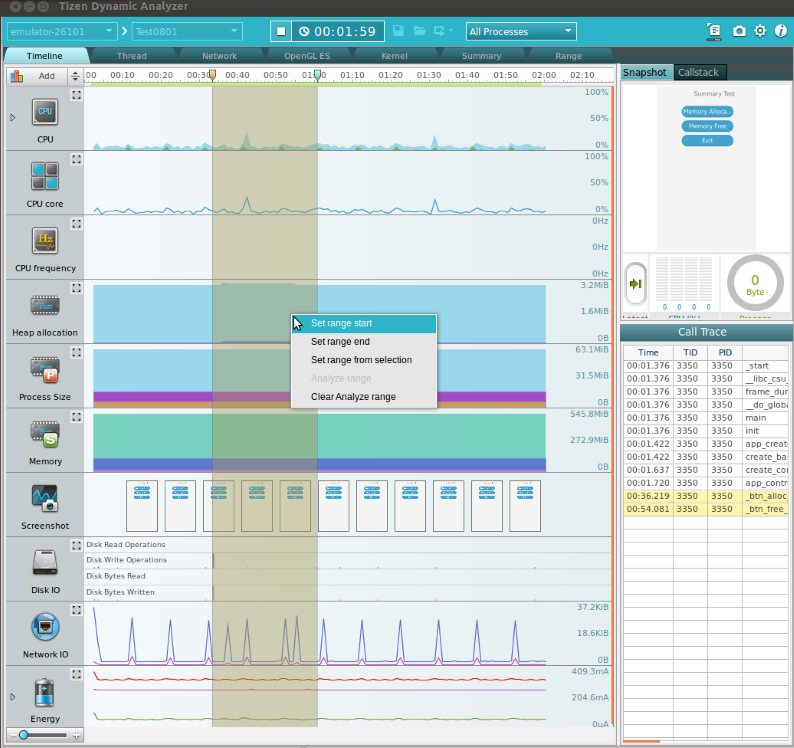
- Set the start and end time using the context menu:
- Right-click and select Set range start and Set range end.
- Right-click and select Analyze range.
- Set the start and end time from the selection area of the timeline using the context menu:
- Drag the timeline, right-click, and select Set range from selection.
- Right-click and select Analyze range.
Figure: Set range on a chart

- Set the start and end time using the context menu:
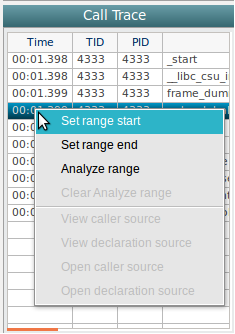
- Table (all tables, except profiling)
- Set the start and end time using the context menu:
- Right-click and select Set range start and Set range end.
- Right-click and select Analyze range.
Figure: Set range on a table

- Set the start and end time using the context menu:
In the context menu, select Clear Analyze range to clear the set range values and close the range page. The start and end time selection is not removed.
The Range information tab closes when you click Clear Analyze range in the context menu, close the Range tab, or open, replay, or restart a trace. The Range information tab has the same views as the Summary tab, but displays only the data of the selected range.
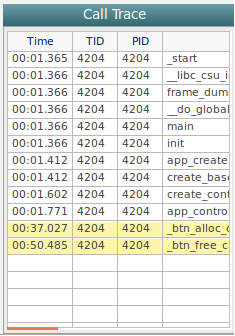
When range information is created, the values within the range are displayed in yellow in the other views.
Figure: Range area in the Call Trace view

