

Summary
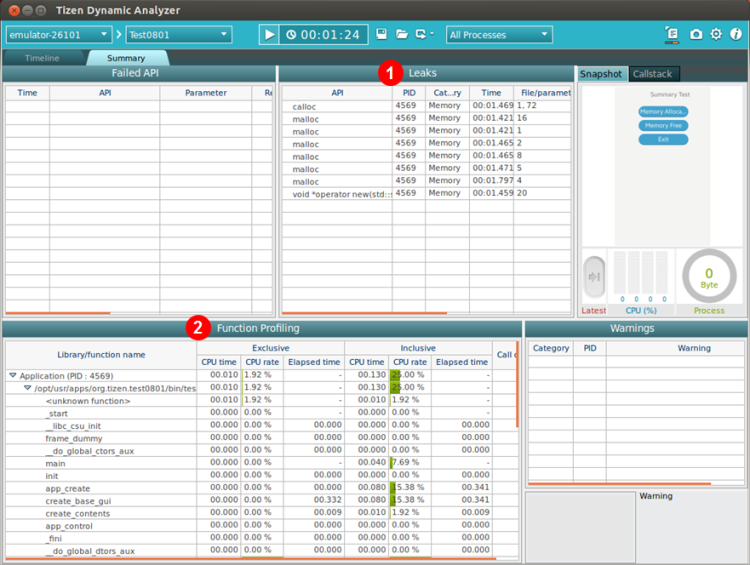
The Summary tab of the dynamic analyzer provides various information about the application performance.
The tab consists of the following views:
- Leaks view shows the leaks that occur when using memory or a file.
- Function Usage Profiling view shows profiling information of the used methods.
Figure: Summary information
Leaks
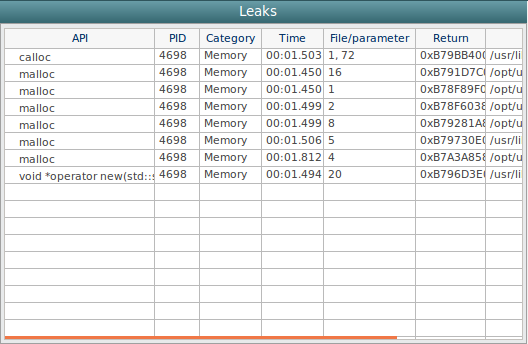
The Leaks view shows data that is recognized as a leak on application runtime, mainly related to memory allocation and file operations.
Figure: Leaks view
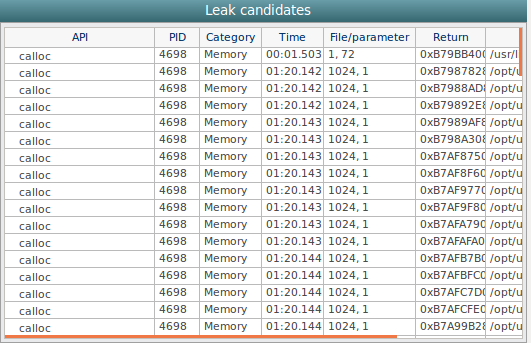
The Leak candidates view shows data that is estimated as a leak in the running application, mainly due to memory allocation and file operations.
Figure: Leak candidates view
These views have the following columns:
- API is the name of the API.
- PID is the identifier of the process.
- Category classifies the API type (such as file or memory).
- Time shows the time when the API is called.
- File/parameter shows the parameter (for a memory leak) or the file path (for a file or socket leak).
- Return shows the return value of the API.
- Library is the name of the caller library.
Function Usage Profiling
The Function Usage Profiling view shows the method usage information of an application. The information is divided into 2 units:
- Application directory contains the methods that are created in the application code.
- Dependent library directory contains the methods that are used in the application code.
The view has the following columns:
- Library or function name (text) shows the library unit (application or dependent), the binary/library name, and the method name in a tree format.
- Exclusive CPU time (float, second) defines the exclusive CPU time.
- Exclusive CPU rate (rate, percent) defines the exclusive CPU rate.
- Exclusive Elapsed time (time) defines the exclusive elapsed time.
- Inclusive CPU time (float, second) defines the inclusive CPU time.
- Inclusive CPU rate (rate, percent) defines the inclusive CPU rate.
- Inclusive Elapsed time (time) defines the inclusive elapsed time.
- Call count (integer) shows the number of times the method has been called.
Exclusive time is the amount of execution time that passed within the method, excluding the time spent in methods called from the method in question. Inclusive time is the amount of execution time that passed within the method, including the time spent in method called from the method in question.
CPU time is the actual CPU time consumed by the process. The value is obtained by sampling. Elapsed time is the wall-clock time, meaning time elapsed between the method entry and method exit.
