Handling Advanced Dynamic Analyzer Tasks
PUBLISHED
![]()
![]()
Dependencies
- Tizen Studio 1.0 and Higher
Content
This topic explains some additional functionality of the Dynamic Analyzer.
Range Inspection
You can analyze specific ranges using markers or drag and drop operations.
Range Inspection with Markers
You can create markers at specific times and analyze the time between the markers:
- Create the markers by double-clicking a chart or detail table view that has a timestamp.
- Right-click between the markers, and select Select range.
The table data is updated based on the range inspection results.
Figure: Range inspection with markers
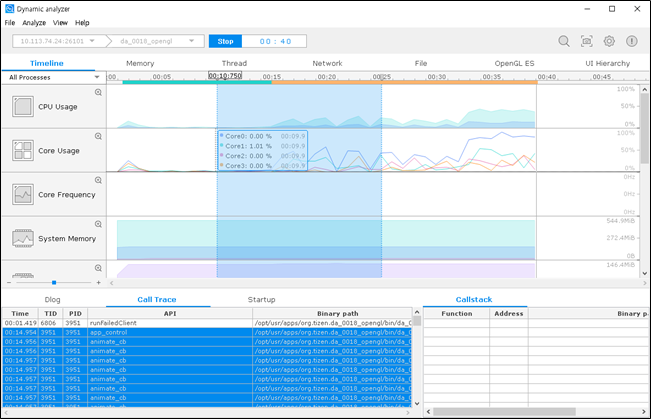
You can create as many markers as you want, and can move the marker by dragging and dropping with a mouse. To delete a marker, double-click it.
Range Inspection with Drag and Drop
If you drag and drop on a chart view, a range is set and the table data is updated based on the range inspection results.
Figure: Range inspection with drag and drop
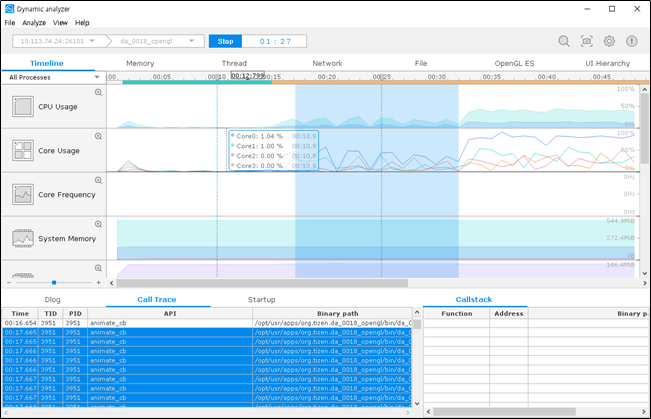
The drag and drop action creates a temporary range. If you click another area on the chart view, the range selection is removed.
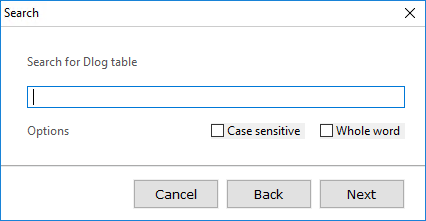
Search Dialog
You can search for a specific keyword in the detail table view, and the search result is highlighted by color.
You can set some search parameters:
- Case sensitive: Case-sensitive matching
- Whole word: Whole word matching
Figure: Search dialog
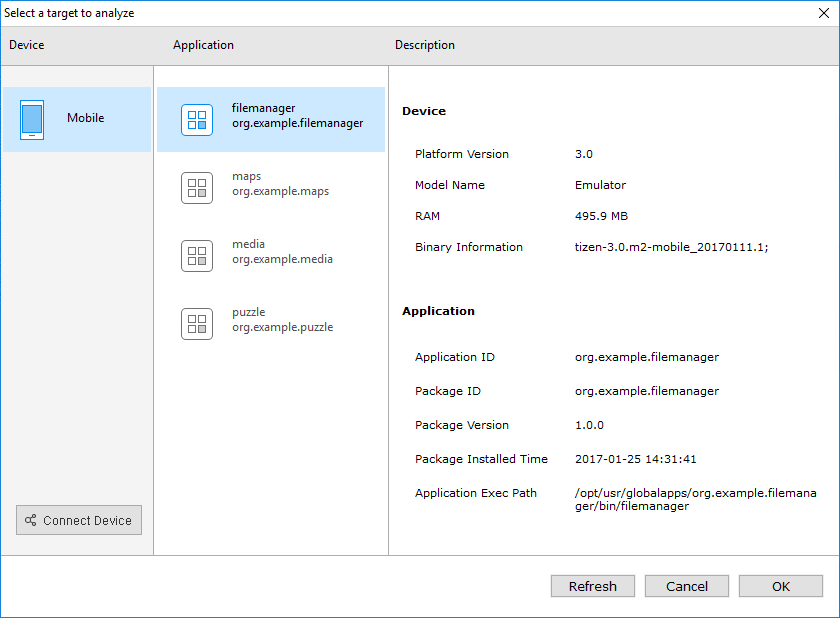
Target Dialog
You can check the connected target information in the target dialog:
- Device: Device type of the connected target (Mobile/Wearable/TV)
- Application: List of applications that can be analyzed in the connected target
- Description: Detail information about the connected target:
- Platform Version
- Model Name
- RAM
- Binary Information
- Application ID
- Package ID
- Package Version
- Package Installed Time
- Application Exec Path
Figure: Target dialog
Data Load and Save Dialogs
You can save the tracing result into a file and load it later for analysis:
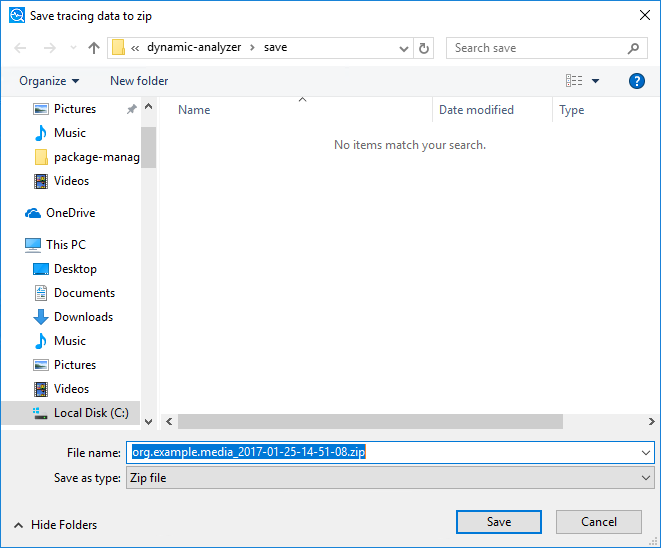
- You can save the analysis result to a ZIP file.
Figure: Saving data
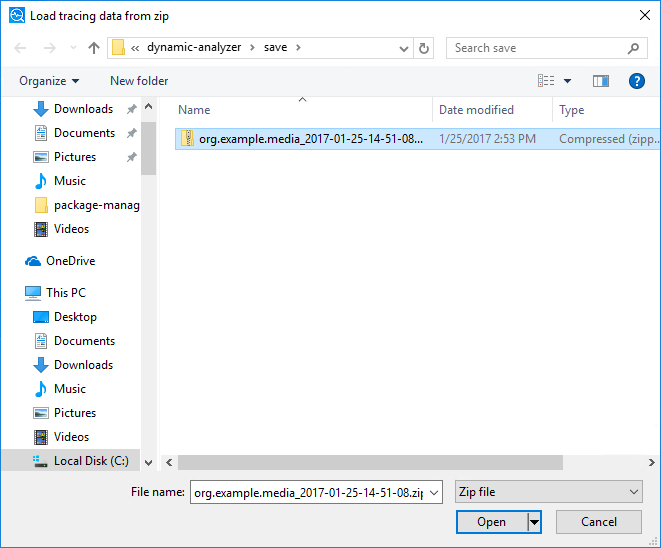
- You can load the analysis result from the ZIP file. After loading, the chart and table data are updated from the loaded data.
Figure: Loading data
Preference Dialog
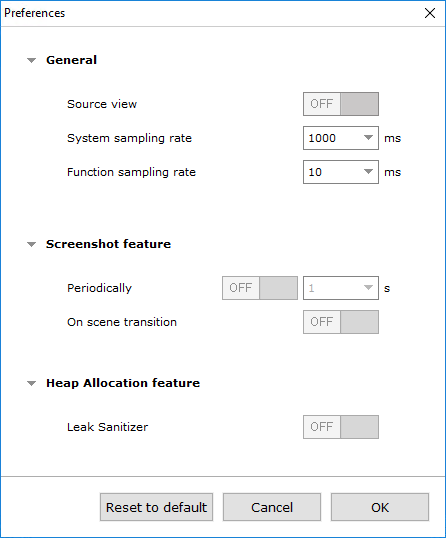
To adjust the Dynamic Analyzer functions during a trace, you can open the preference dialog by clicking the Preference button on the toolbar.
The preference dialog contains the following settings:
- General
- Source view: Enable the source view option that opens the source view in the detail table view.
- System sampling rate: Define the system sampling rate.
- Function sampling rate: Define the function sampling rate.
- Screenshot feature
- Periodically: Enable screenshot captures periodically and set the time between captures in seconds.
- On scene transition: Enable screenshot captures on scene transitions.
- Heap Allocation feature
- Leak Sanitizer: Enable the Leak Sanitizer analysis to detect memory leaks in the application.
Figure: Preference dialog
Keyboard Shortcuts
You can trigger some major analysis functions with keyboard shortcuts.
Table: Keyboard shortcuts
| Command | Shortcut | |||
|---|---|---|---|---|
| Windows® | macOS | |||
| File | New | Ctrl + N | Command + N | |
| Load | Ctrl + O | Command + O | ||
| Save | Ctrl + S | Command + S | ||
| Exit | Ctrl + Q | Command + Q | ||
| Analyze | Start or stop trace | F5 | Fn + F5 | |
| Search | Ctrl + F | Command + F | ||
| Target | Ctrl + T | Command + T | ||
| Screenshot | F9 | Fn + F9 | ||
| Preferences | F10 | Fn + F10 | ||
| Detail | Ctrl + H | Command + H | ||
| Navigate | Zoom in | W | W | |
| Zoom out | S | S | ||
| Move left | A | A | ||
| Move right | D | D | ||
| Move first | Q | Q | ||
| Move end | E | E | ||
| Help | How to use Dynamic Analyzer | F1 | Fn + F1 | |
Table Data Copying and Export
To copy or export data in TSV (Tab Separated Values) format from a table in the Dynamic Analyzer:
- Select the data you want to copy or export.
- Right-click the selection and select:
- Copy to copy the selected data to the clipboard.
You can also copy using the Ctrl + C or Ctrl + Insert keyboard shortcuts.
- Export to file to export the selected data to a TSV file.
You can define a file location for the exported data.
- Copy to copy the selected data to the clipboard.
Command Line Interface
You can use the command line interface (CLI) with the Dynamic Analyzer. You can collect tracing data from your application from a target device and later open it in the Dynamic Analyzer GUI (graphical interface) for analysis.
To launch tracing, you must know the target device name (or IP address) and your application identifier, and you must specify the profiling features to be enabled.
To view the CLI help, run the ./dacli.jar -h command:
Usage: dacli.jar <command> [options...]
List of commands:
    devices : show list of connected devices and emulators
        -u                           show list of devices where tracing is running

    apps <ip:port|serial> : show list of applications of specified target

    start <ip:port|serial> : start tracing on specified target for specified
                             application using selected tracing features
        -a <application identifier>  identifier of application to trace
        -o <output filename>         redirect tracing output to file
        -C,--cpu-usage <arg>         select cpu usage tracing
                                     Possible arguments: usage, core, frequency, all
                                     If no arguments provided - 'all' is selected
        -M,--memory <arg>            select memory tracing
                                     Possible arguments: system, process, heap, all
                                     If no arguments provided - 'process,system' is selected
        -F,--file <arg>              select file tracing
                                     Possible arguments: io, analysis, all
                                     If no arguments provided - 'all' is selected
        -G,--graphics <arg>          select graphics tracing
                                     Possible arguments: opengl, all
                                     If no arguments provided - 'all' is selected
        -N,--network <arg>           select network tracing
                                     Possible arguments: io, analysis, all
                                     If no arguments provided - 'all' is selected
        -T,--thread-analysis         select thread analysis tracing
        -U,--ui-event                select ui event tracing
        -P,--peripheral-status       select peripheral status tracing
        -E,--power-estimation        select power estimation tracing
        -S <period>                  enable screenshots capturing periodically
        -s,                          enable screenshots capturing on scene transition
        -L,--leak-sanitizer          select LeakSanitizer analysis tracing
                                     Works only if 'heap' memory tracing is selected and does not work
                                     with thread analysis tracing

    stop <ip:port|serial> : stop currently running tracing process on specified device

    version : print information about version
Environment Setup
The CLI tool requires Java VM installed on your computer. The minimum supported version is Java VM 1.7.
You can launch the dacli.jar file from the Dynamic Analyzer installation directory by using the ./dacli.jar command. To make launching easier, add the directory to your PATH variable. For example, use the following command on Ubuntu:
export PATH=$PATH:<path-to-tizen-studio>/tools/dynamic-analyzer/
- Grant execution permissions to the
dacli.jarfile:chmod +x dacli.jar - Use the following command to launch the Dynamic Analyzer CLI tool:
java -jar dacli.jar
Useful Commands
The following commands are the most useful when controlling the Dynamic Analyzer with the CLI:
devicesThe command shows a list of connected devices. If you specify the
-uoption, only the devices where tracing is already launched through the CLI are listed.Command syntax:
devices [-u]
For example:
$ ./dacli.jar devices
List of connected devices:
    <Device Name> <Serial Number>
    m-0818-1      emulator-26101
Take note of the device serial number. It is used to specify the device in other Dynamic Analyzer CLI commands.
appsThe command shows a list of installed applications on a specified device.
Command syntax:
apps <ip:port|serial>
For example:
$ ./dacli.jar apps emulator-26101
List of installed applications:
  <Application ID>               : <Package ID>             : <Application Name>
  org.tizen.camera-app           : org.tizen.camera-app     : Camera
  org.tizen.calendar             : org.tizen.calendar       : Calendar
  org.tizen.contacts             : org.tizen.contacts       : Contacts
  org.tizen.gallery              : org.tizen.gallery        : Gallery
  org.tizen.browser              : org.tizen.browser        : Internet
Take note of your application identifier. It is used to specify the application in other Dynamic Analyzer CLI commands. If you cannot find your application, make sure it has been installed (for example, from Tizen Studio). The application ID can differ from the package ID.
startThe command starts tracing your application on the specified device. In addition, you must specify at least 1 profiling feature to be enabled.
Command syntax:
start <ip:port|serial> -a <application identifier> <features> [options...]
For example, you can specify the
-Coption to enable all CPU profiling features. You can see a list of all available features in the command help message.The following command starts the Camera application on the emulator-26101 device with the CPU profiling features enabled:
$ ./dacli.jar start emulator-26101 -a org.tizen.camera-app -C
DA tracing started.
Run "dacli stop emulator-26101" to finish it.
You can specify the
-ooption to customize the tracing result location.stopThe command stops the active tracing process on a specified device.
Command syntax:
stop <ip:port|serial>
For example:
$ ./dacli.jar stop emulator-26101
DA tracing finished.
Total time:   1m 37.777s
Tracing time: 1m 29.362s
Output:       /home/eclipse/tizen-sdk-data/dynamic-analyzer/save/org.tizen.camera-app_2016-08-18-16-51-53.zip
In the command output:
- Total time is the time required to perform all the tracing activities: connection, command communication, data interchange, and activity finalization.
- Tracing time is the pure tracing time: from the beginning to the end of your program.
- Output is the location where the tracing result is stored: it can be opened for further analysis in the Dynamic Analyzer GUI.
versionThe command displays information about the Dynamic Analyzer, including its version, build time, and useful links.
Command syntax:
version
For example:
$ ./dacli.jar version
DA Version      2.4.4
Build Time      20161213-0258
Tizen Site      http://www.tizen.org
Release Note    https://developer.tizen.org/development/tizen-studio/download/release-notes
In the command output:
- DA Version is the version of the Dynamic Analyzer.
- Build Time is the build timestamp.
- Tizen Site is the link to the Tizen Web site.
- Release Note is the link to the Tizen Studio Release Notes.