Web Inspector
You can debug Web applications using the JavaScript Debugger tool. The JavaScript Debugger is based on Webkit Web Inspector, and has been modified to support remote debugging.
The JavaScript Debugger supports the following panels:
- Elements Panel
- Resources Panel
- Network Panel
- Sources Panel
- Timeline Panel
- Profiles Panel
- Console Panel
Figure: JavaScript Debugger panels
When debugging with the Emulator, the Emulator communicates with the Google Chrome™ browser through the HTTP protocol.
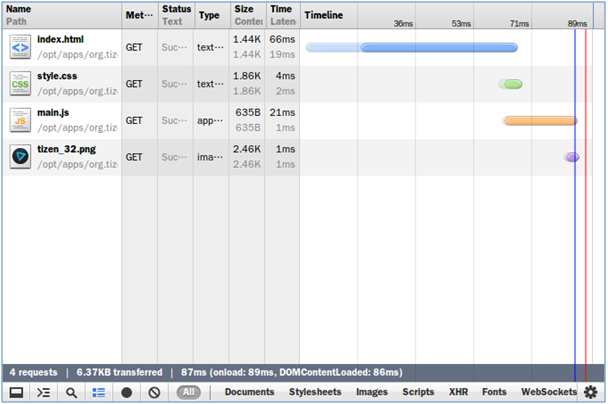
When the JavaScript Debugger is started, the Network panel is off. To enable the Network panel and start monitoring the resource loading status, press the F5 key. This reloads the current page and displays the load time on the Network panel.
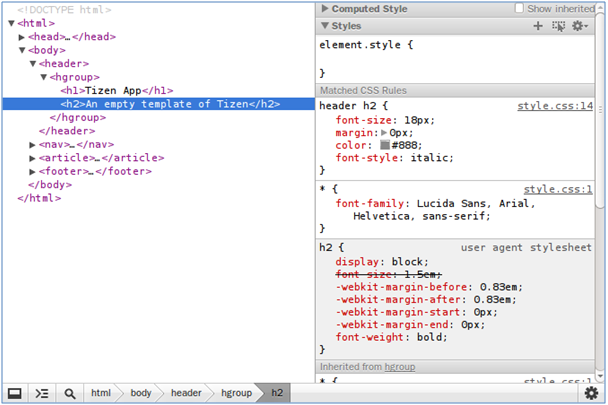
Elements Panel
The Elements panel of the JavaScript Debugger allows you to see the Web page components (the DOM tree, CSS style, and Document Object Model).
Figure: Elements panel
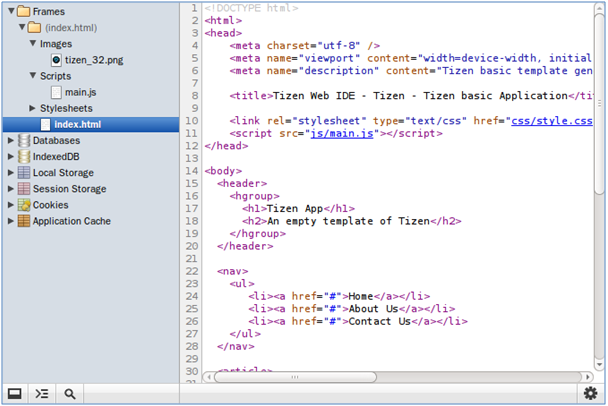
Resources Panel
The Resources panel of the JavaScript Debugger allows you to inspect resources. You can interact with frames containing resources, such as HTML, JavaScript, CSS, images, and fonts. You can also inspect HTML5 databases, local storage, cookies, and application cache.
Figure: Resources panel
Network Panel
The Network panel of the JavaScript Debugger allows you to inspect resources downloaded over the network. You can also inspect the HTTP header, response, cookies, and preview.
Figure: Network panel
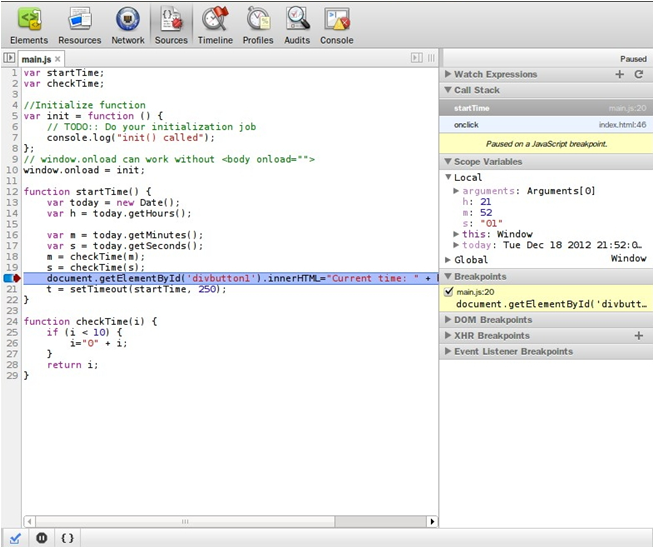
Sources Panel
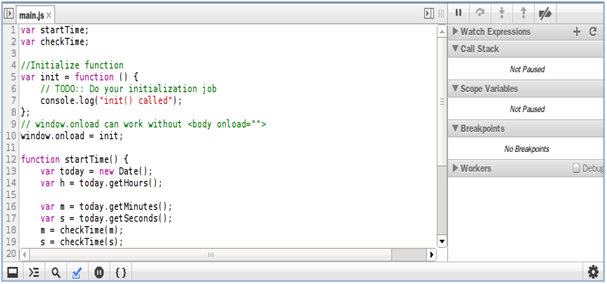
The Sources panel of the JavaScript Debugger allows you to inspect the JavaScript source page. You can debug your JavaScript code. This panel supports watch expressions, callstack, scope variables, and break point operation. In addition, it supports basic debugging operations: continue, step over, step into, and step out.
Figure: Sources panel
Timeline Panel
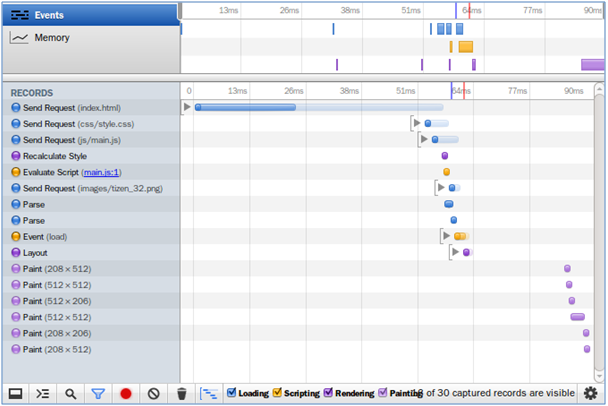
The Timeline panel of the JavaScript Debugger allows you to perform advanced timing and speed analysis. You can see how long the browser takes to handle DOM events, and rendering and painting windows.
Figure: Timeline panel
Profiles Panel
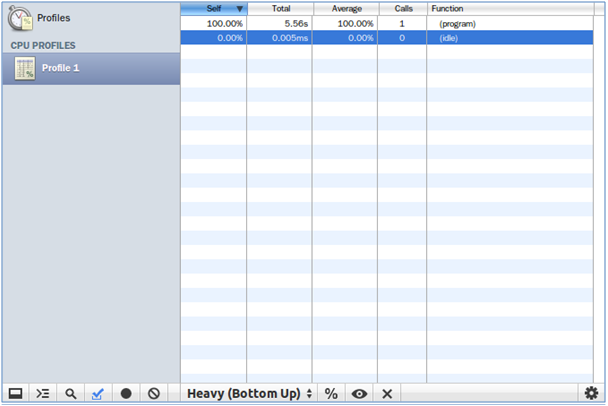
The Profiles panel of the JavaScript Debugger allows you to inspect the JavaScript performance analyses. You can inspect CPU profiles or CSS Select profiles.
Figure: Profiles panel
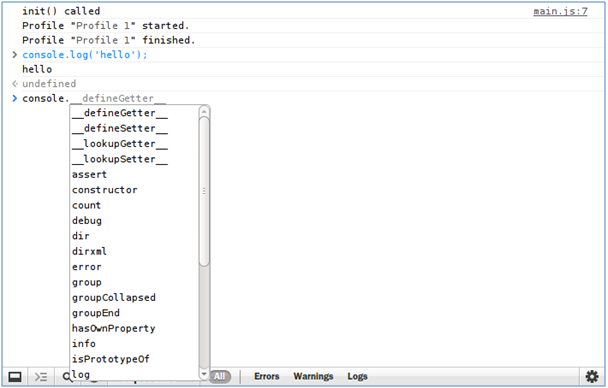
Console Panel
The Console panel of the JavaScript Debugger allows you to inspect the JavaScript console operation. You can interact with your page programmatically. Any errors or warnings on your page are shown in the console.
Figure: Console panel
