Charts for Tizen Web app
PUBLISHED
Introduction
Charts are a great way to view data. Using charts, not only we can summarize huge data but also get a more pleasant view of it. App that is based on data collection and processing can be made more interactive and visually attractive by using charts.
Chart.js
Chart.js is an open source (MIT) JavaScript library for displaying beautiful charts in HTML5 applications. The charts are rendered on HTML5 canvas element. It is supported in web, mobile and tablet. It offers most common type of charts like line, bar, pie etc.
It has a flat UI and works on Tizen mobile/wearable.
It can be imported by using both traditional "script" tags and modern module loaders.
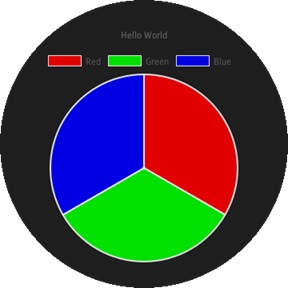
Fig 1: Screenshot of a pie chart
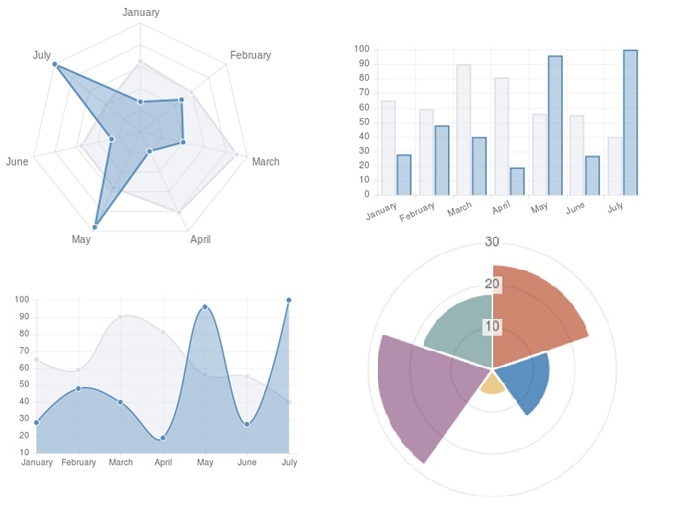
Fig 2: Screenshot of some other charts
Steps to create a simple web app using chart.js:
Step 1: Add “Chart.js” in 'script' tag
<script src="js/Chart.js"></script>
Step 2: Then add a HTML5 'canvas' element in code
<canvas id="mychart" height="250px"/>
- In this code, “height” is set to 250px so that it fits properly on Gear S2.
Step 3: Then, in “main.js”, add the following code to configure the chart
 var config = {
  type: “pie”,
  data: {
   datasets: [{
    data: [ 33, 33, 33 ],
    backgroundColor: [ "#FF0000", "#00FF00", "#0000FF" ],
    label: “3.142 Chart”
   }],
   labels: [ "Red", "Green", "Blue" ]
  }, {
    //add more data if you need
    //data: [ 10, 20, 30, 40 ],
    //backgroundColor: [ "#AA0000", "#00BB00", "#0000CC" ],
    //label: “another Chart”
   }],
   labels: [ "Red", "Green", "Blue" ]
  }
  options: {
   responsive: true,
   legend: {
    position: "top",
   },
  title: {
   display: true,
   text: "Hello World"
  }
 }
};
- type = line, bar, radar, polar, pie and doughnut.
- data = data to put on the chart (it can be datasets too for like doughnut chart).
- backgroundColor = the color of the chart items.
- label = label of the chart.
- labels = the label of the individual items, can be viewed when tapped on the item.
- options = set extra features.
- responsive = set true or false.
- legend = here you can set the visibility of the legend of your chart’s items and its “position” as top or bottom.
- title = set visibility of the chart’s title and its value.
Step 4: Using “window.onload” function, create the chart
window.onload = function() {
    var ctx = document.getElementById("mychart ").getContext("2d");
    window.myDoughnut = new Chart(ctx, config);
};
Step 5: To update and refresh the chart use
window.myDoughnut.update();
- To know more, please check the website: http://www.chartjs.org/
Some application ideas
- A graphical chart of your daily/weekly/monthly expenditures.
- A health application that shows work out report graphically.
- Application that delivers analytical reports.
Summary
Chart.js is a wonderful data visualization library. Using it, we can make our app visually attractive and take advantage of it's features.
Please check the attached sample code for example.