Web Analysis
The dynamic analysis for a Web application provides a startup and function analysis from Tizen 2.4 onwards.
You can check the information from the Timeline and Summary tabs.
The features consist of the following views:
- Startup shows the startup information of the application.
- Call Trace shows the user API calls.
- Function Usage Profiling shows profiling information of the used methods.
Startup
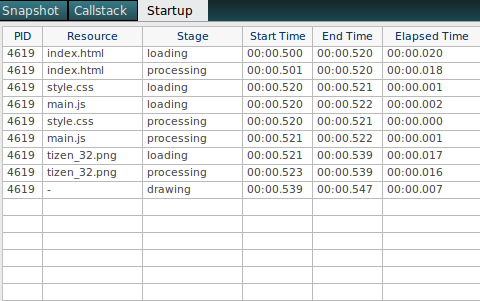
The Startup view is located at the top of the Timeline tab, and shows when the Web application is started.
You can start the application faster by reducing its loading time.
Figure: Startup view

The view has the following columns:
- PID is the process ID.
- Resource is the resource file.
- Stage is the current stage of the application:
- loading loads each resource.
- processing processes each resource.
- drawing draws (once) when the loading of main resource is finished.
- Start Time is the start time of the stage.
- End Time is the end time of the stage.
- Elapsed Time is the elapsed time of the stage.
Call Trace
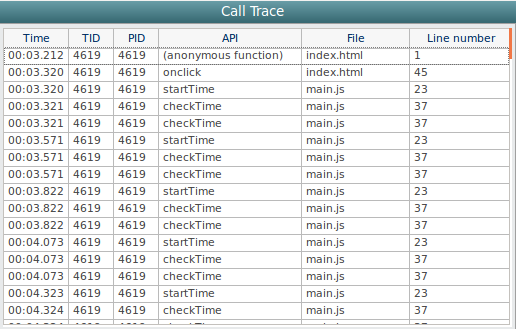
The Call Trace view is located at the bottom of the Timeline tab, and shows the user method callstack that occurs during an application execution.
When you click specific point on the Timeline chart, the Call Trace view scrolls to the corresponding item. (If you select a range, all corresponding items are highlighted.)
Figure: Call Trace view

The view has the following columns:
- Time is the calling time of the API.
- TID is the thread ID.
- PID is the process ID.
- API is the API name.
- File is the source file name.
- Line number is the API line number in the source file.
Function Usage Profiling
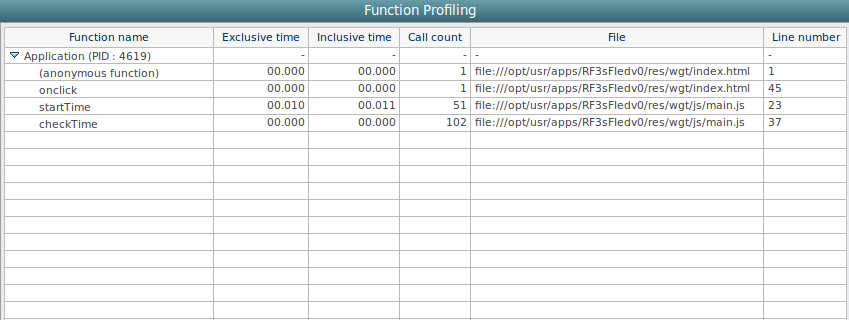
The Function Usage Profiling view is located at the bottom of the Summary tab, and shows the method usage information of an application.
When analyzing the application performance, the execution time of each method is one of the most significant factors. You can improve the application performance by identifying unexpected bottleneck locations, and analyzing and optimizing the most used methods in the dynamic analyzer.
The profiling tree view shows a list of the methods which constitute the application. To view the list, click Application in the Function name column.
Figure: Function Usage Profiling view

The view has the following columns:
- Function name shows the method name being profiled.
- Exclusive time defines the exclusive elapsed time. (The Exclusive time is the amount of runtime passed while within that method, excluding the time spent in methods called from that method.)
- Inclusive time defines the inclusive elapsed time. (The Inclusive time is the amount of runtime passed while within that method, including the time spent in methods called from that method.)
- Call count shows the total number of times this method has been called.
- File is the source file path.
- Line number is the API line number in the source file.


