CheckPoint Analysis
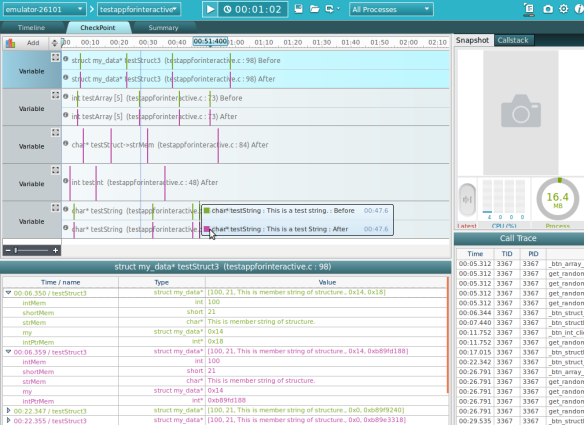
The CheckPoint tab of the dynamic analyzer shows the actual value of variables at specific points of code (CheckPoint). You can trace the changes in the variable value to help in the application debugging.
The CheckPoints can be set in the IDE source editor, and the CheckPoint value is shown in the dynamic analyzer.
The tab consists of the following views:
- CheckPoint chart shows the values of all variables.
- CheckPoint list shows the values of a specific variable selected on the chart.
Figure: CheckPoint analysis
Setting the CheckPoint in the IDE
To use the CheckPoint Analysis, you must set a CheckPoint in the IDE source editor. The CheckPoint can be set on any valid point, which is a variable in an executable line:
- To trace, for example, the value of the testString variable on line 59 (as shown in the following figure), select the variable and open the context menu.
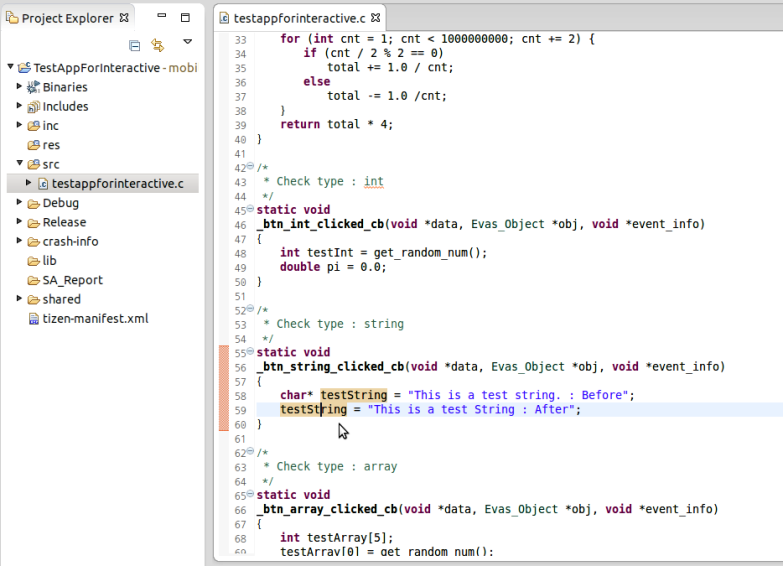
- To add the CheckPoint, click Add to Checkpoint of Dynamic Analyzer in the context menu.
The following dialog opens. You can select to get values from 2 points (before and after the line execution).
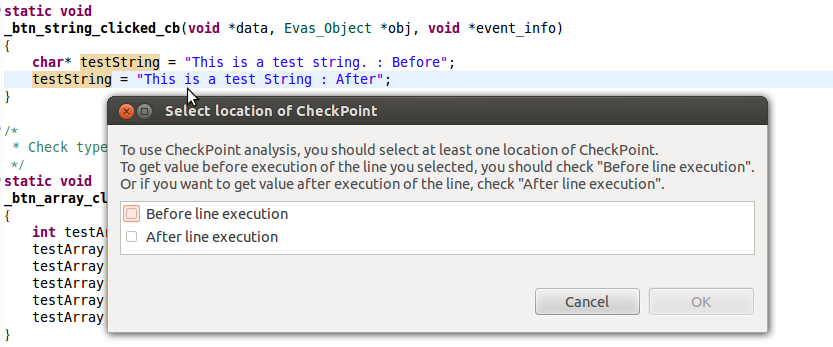
The added CheckPoints are shown on a vertical ruler (shown below) and the CheckPoint view.

- To remove a CheckPoint, use the CheckPoint view.

After setting the CheckPoint, run the CheckPoint analysis from the project context menu by selecting Profile As > Profile With Dynamic Analyzer.
CheckPoint Chart
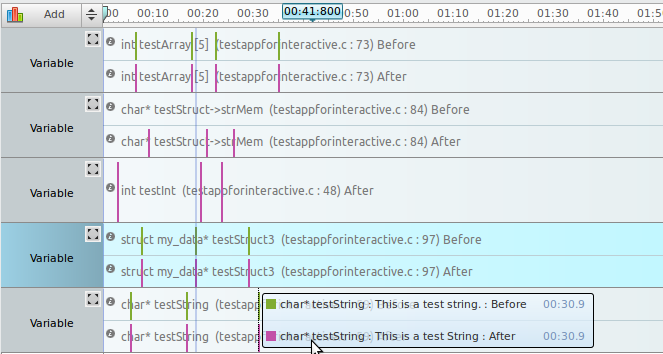
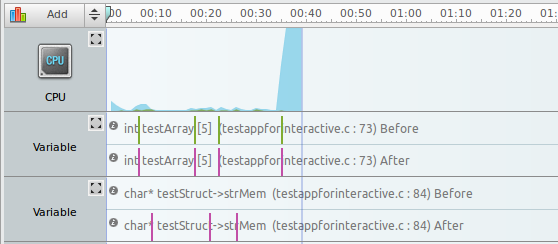
The CheckPoint chart displays values of all variables set in the IDE. Each chart includes information of all CheckPoints. The information is shown with the format:
Variable type + variable name + (source file name: line number) + Before/After
Every time a CheckPoint is executed on a target device or the Emulator, a color bar marks the time on the chart and a tooltip shows the detailed value at the time. To see specific CheckPoint values, select the chart. To see all values from a CheckPoint, see the CheckPoint list.
Figure: CheckPoint chart
You can also add a Timeline chart to the tab using the Add button.
Adding a Timeline chart
CheckPoint List
When you select a CheckPoint in the CheckPoint chart, all the values from the CheckPoint are shown in a list view.
If the variable is an array type, all its elements are shown in the list. If the variable is a structure type, all its members are shown.
Figure: CheckPoint list (array)
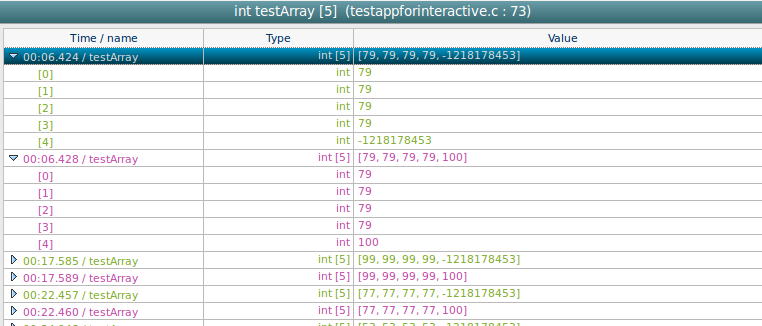
Figure: CheckPoint list (structure)
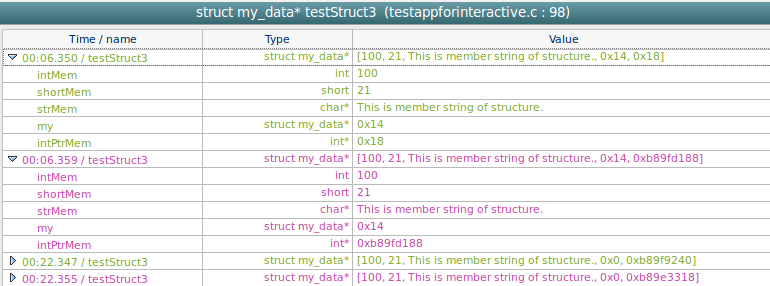
You can relate a function call with the CheckPoint values of a specific time. If you select a row in the list, the related function call is highlighted in the Call Trace.


